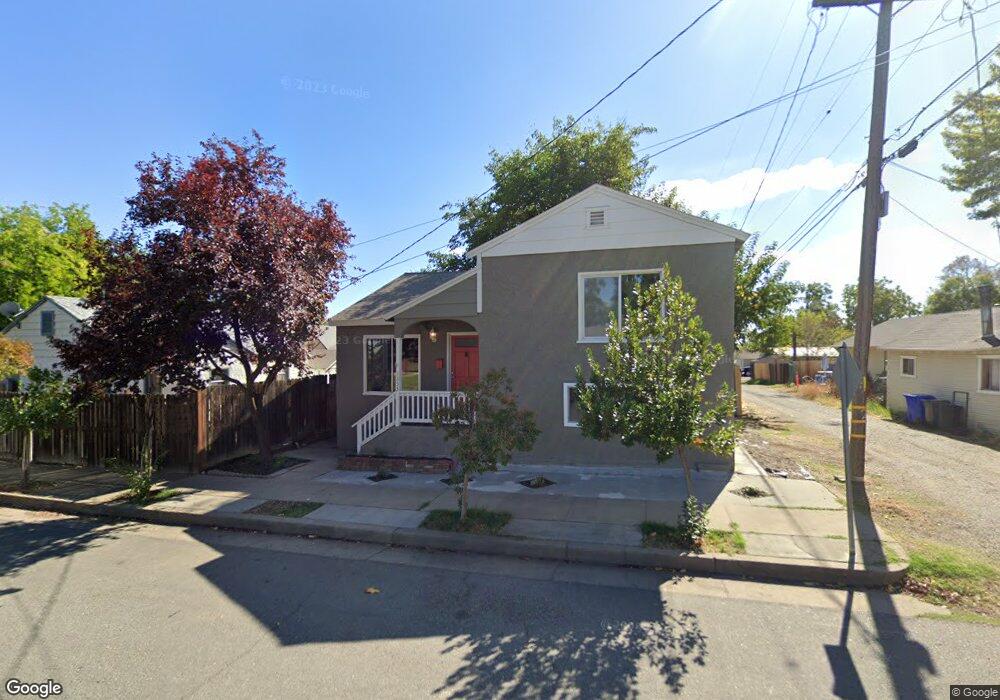
1353 Luning St Red Bluff, CA 96080
Estimated Value: $259,828 - $291,000
3
Beds
2
Baths
1,220
Sq Ft
$225/Sq Ft
Est. Value
About This Home
This home is located at 1353 Luning St, Red Bluff, CA 96080 and is currently estimated at $274,707, approximately $225 per square foot. 1353 Luning St is a home located in Tehama County with nearby schools including Bidwell Elementary School, Vista Preparatory Academy, and Red Bluff High School.
Ownership History
Date
Name
Owned For
Owner Type
Purchase Details
Closed on
Mar 6, 2024
Sold by
Sunday Kristen
Bought by
Duvarney Rebecca
Current Estimated Value
Home Financials for this Owner
Home Financials are based on the most recent Mortgage that was taken out on this home.
Original Mortgage
$9,291
Outstanding Balance
$3,903
Interest Rate
6.69%
Mortgage Type
FHA
Estimated Equity
$270,804
Purchase Details
Closed on
Jul 31, 2023
Sold by
Mccally Thomas C and Mccally Christine
Bought by
Sunday Kristen
Home Financials for this Owner
Home Financials are based on the most recent Mortgage that was taken out on this home.
Original Mortgage
$145,000
Interest Rate
6.69%
Mortgage Type
Seller Take Back
Create a Home Valuation Report for This Property
The Home Valuation Report is an in-depth analysis detailing your home's value as well as a comparison with similar homes in the area
Purchase History
| Date | Buyer | Sale Price | Title Company |
|---|---|---|---|
| Duvarney Rebecca | $265,500 | Placer Title Company | |
| Sunday Kristen | $155,000 | Timios Title |
Source: Public Records
Mortgage History
| Date | Status | Borrower | Loan Amount |
|---|---|---|---|
| Open | Duvarney Rebecca | $9,291 | |
| Open | Duvarney Rebecca | $260,666 | |
| Previous Owner | Sunday Kristen | $145,000 |
Source: Public Records
Tax History
| Year | Tax Paid | Tax Assessment Tax Assessment Total Assessment is a certain percentage of the fair market value that is determined by local assessors to be the total taxable value of land and additions on the property. | Land | Improvement |
|---|---|---|---|---|
| 2025 | $1,609 | $270,784 | $61,200 | $209,584 |
| 2023 | $839 | $80,229 | $14,413 | $65,816 |
| 2022 | $833 | $78,657 | $14,131 | $64,526 |
| 2021 | $800 | $77,115 | $13,854 | $63,261 |
| 2020 | $817 | $76,325 | $13,712 | $62,613 |
| 2019 | $822 | $74,830 | $13,444 | $61,386 |
| 2018 | $760 | $73,364 | $13,181 | $60,183 |
| 2017 | $767 | $71,926 | $12,923 | $59,003 |
| 2016 | $717 | $70,517 | $12,670 | $57,847 |
| 2015 | -- | $69,459 | $12,480 | $56,979 |
| 2014 | $695 | $68,099 | $12,236 | $55,863 |
Source: Public Records
Map
Nearby Homes
- 1356 Park Ave
- 1359 2nd St
- 1500 Walbridge St
- 1570 Douglass St
- 1426 Lincoln St
- 1707 Luning St
- 1549 Jackson St
- 1715 Walbridge St
- 1710 Luning St
- 1313 Jackson St
- 1835 Douglass St
- 605 Breckenridge St
- 0 Derby Unit 24724349
- 927 Cedar St
- 1158 Madison St
- 545 Cedar St
- 2132 Reta Way
- 728 Lincoln St
- 0 Ludlow Ave Unit SN25045951
- 147 Treasure Dr
Your Personal Tour Guide
Ask me questions while you tour the home.