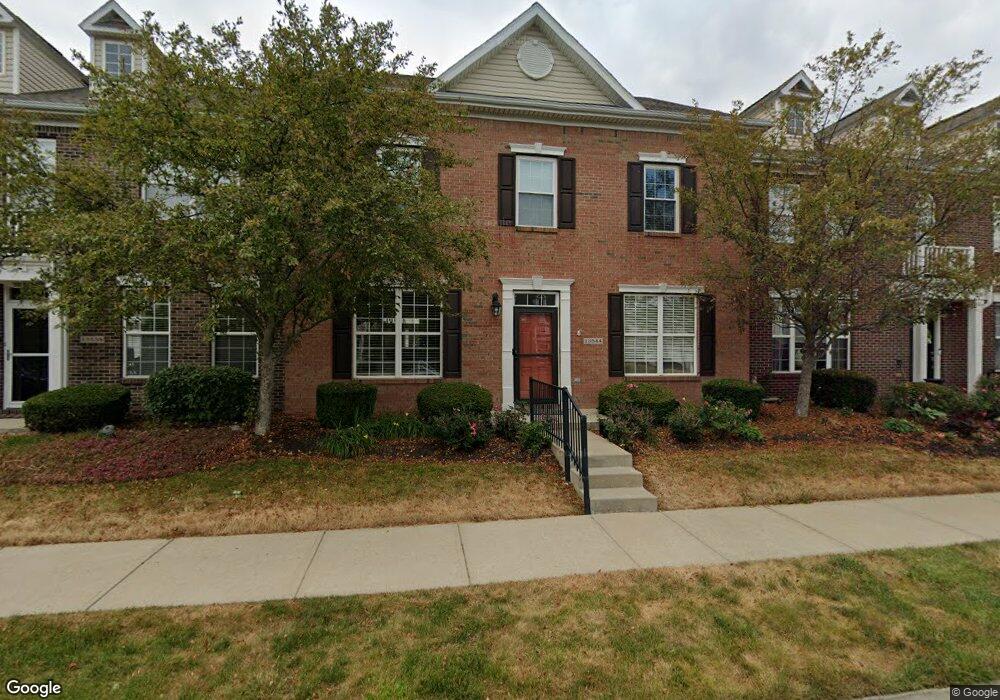
13544 Molique Blvd Unit 604 Fishers, IN 46037
Estimated Value: $312,223 - $333,000
2
Beds
3
Baths
2,378
Sq Ft
$136/Sq Ft
Est. Value
About This Home
This home is located at 13544 Molique Blvd Unit 604, Fishers, IN 46037 and is currently estimated at $322,306, approximately $135 per square foot. 13544 Molique Blvd Unit 604 is a home located in Hamilton County with nearby schools including Overland Park Elementary School, Thorpe Creek Elementary School, and Hamilton Southeastern Intermediate / Junior High.
Ownership History
Date
Name
Owned For
Owner Type
Purchase Details
Closed on
Mar 1, 2023
Sold by
Restated Mary Ellen Ballard Trust
Bought by
Kelly Noreen
Current Estimated Value
Purchase Details
Closed on
Mar 1, 2017
Sold by
Ballard Mary Ellen
Bought by
Ballard Mary Ellen and Mary Ellen Ballard Trust
Purchase Details
Closed on
Sep 23, 2016
Sold by
Mckay Mark B and Mckay Sherri L
Bought by
Balalrd Mary Eileen
Purchase Details
Closed on
Nov 16, 2015
Sold by
Hannigan Terrence J
Bought by
Mckay Mark B and Mckay Sherri L
Purchase Details
Closed on
Dec 19, 2006
Sold by
Portrait Homes Hanover On The Green Llc
Bought by
Hannigan Terrence J
Home Financials for this Owner
Home Financials are based on the most recent Mortgage that was taken out on this home.
Original Mortgage
$167,517
Interest Rate
6.24%
Mortgage Type
Unknown
Create a Home Valuation Report for This Property
The Home Valuation Report is an in-depth analysis detailing your home's value as well as a comparison with similar homes in the area
Home Values in the Area
Average Home Value in this Area
Purchase History
| Date | Buyer | Sale Price | Title Company |
|---|---|---|---|
| Kelly Noreen | -- | None Listed On Document | |
| Ballard Mary Ellen | -- | None Available | |
| Balalrd Mary Eileen | -- | Chicago Title Co Llc | |
| Mckay Mark B | -- | Chicago Title Co Llc | |
| Hannigan Terrence J | -- | None Available |
Source: Public Records
Mortgage History
| Date | Status | Borrower | Loan Amount |
|---|---|---|---|
| Previous Owner | Hannigan Terrence J | $167,517 |
Source: Public Records
Tax History Compared to Growth
Tax History
| Year | Tax Paid | Tax Assessment Tax Assessment Total Assessment is a certain percentage of the fair market value that is determined by local assessors to be the total taxable value of land and additions on the property. | Land | Improvement |
|---|---|---|---|---|
| 2024 | $5,410 | $249,800 | $42,800 | $207,000 |
| 2023 | $2,550 | $244,100 | $42,800 | $201,300 |
| 2022 | $2,687 | $228,700 | $42,800 | $185,900 |
| 2021 | $2,499 | $213,700 | $42,800 | $170,900 |
| 2020 | $2,274 | $195,200 | $42,800 | $152,400 |
| 2019 | $2,185 | $188,600 | $37,000 | $151,600 |
| 2018 | $2,074 | $181,100 | $37,000 | $144,100 |
| 2017 | $1,994 | $177,300 | $37,000 | $140,300 |
| 2016 | $1,940 | $174,400 | $37,000 | $137,400 |
| 2014 | $1,746 | $175,500 | $43,100 | $132,400 |
| 2013 | $1,746 | $167,700 | $43,100 | $124,600 |
Source: Public Records
Map
Nearby Homes
- 13172 Saxony Blvd
- 13330 Saxony Blvd W
- 13484 Molique Blvd
- 13301 Minden Dr
- 13423 E 134th St
- 13616 Whitten Dr N
- 13311 Susser Way
- 13288 E Lieder Way
- 12985 Saxony Blvd
- 13276 E Lieder Way
- 13008 Overview Dr
- 13935 Canonbury Way
- 13315 Patriotic Way
- 12957 E 131st St
- 12880 Oxbridge Place
- 14110 Bay Willow Dr
- 12890 Old Glory Dr
- 12997 Bartlett Dr
- 14237 Bay Willow Dr
- 12994 Dekoven Dr
- 13544 Molique Blvd
- 13538 Molique Blvd
- 13538 Molique Blvd Unit 603
- 13538 Molique Blvd Unit 6/603
- 13550 Molique Blvd
- 13532 Molique Blvd
- 13545 Erlen Dr
- 13545 Erlen Dr Unit 302
- 13539 Erlen Dr
- 13539 Erlen Dr Unit 303
- 13551 Erlen Dr
- 13533 Erlen Dr
- 13232 Saxony Blvd
- 13220 Saxony Blvd
- 13527 Erlen Dr
- 13244 Saxony Blvd
- 13244 Saxony Blvd Unit 704
- 13520 Molique Blvd
- 13256 Saxony Blvd Unit 705
- 13547 Molique Blvd