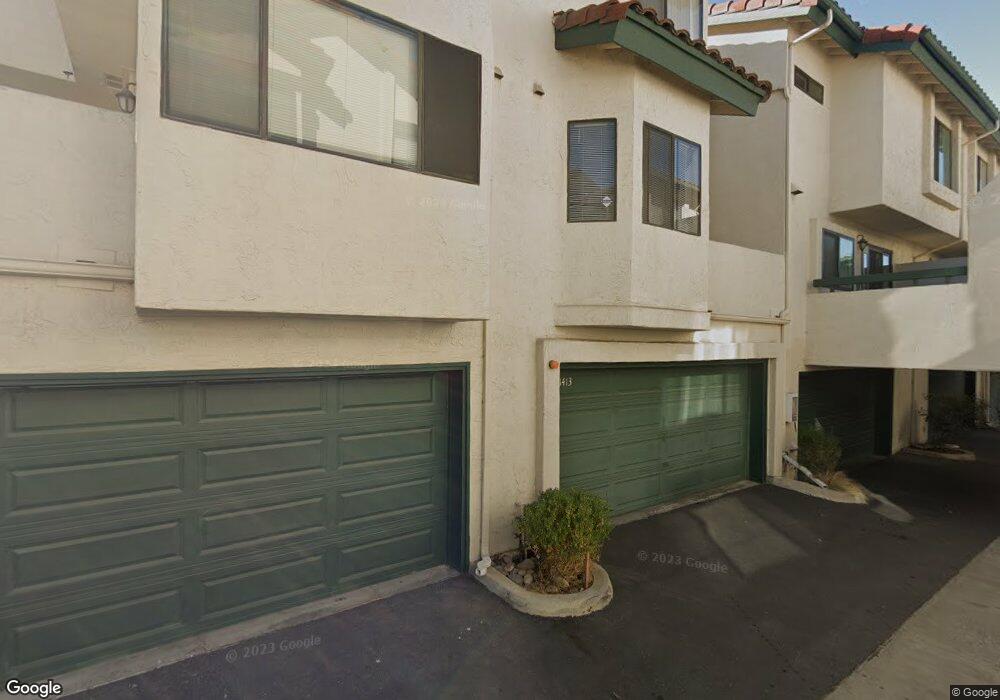
1357 Serena Cir Unit 1 Chula Vista, CA 91910
Rancho Del Rey NeighborhoodEstimated Value: $696,864 - $967,000
3
Beds
3
Baths
1,545
Sq Ft
$504/Sq Ft
Est. Value
About This Home
This home is located at 1357 Serena Cir Unit 1, Chula Vista, CA 91910 and is currently estimated at $777,966, approximately $503 per square foot. 1357 Serena Cir Unit 1 is a home located in San Diego County with nearby schools including Bonita Vista Middle School, Bonita Vista Senior High School, and Discovery Charter School.
Ownership History
Date
Name
Owned For
Owner Type
Purchase Details
Closed on
Sep 4, 2018
Sold by
Lama Carlos M De La
Bought by
Lama Carlos M De La
Current Estimated Value
Purchase Details
Closed on
Feb 26, 2018
Sold by
Lama Carlos Merino De La and Lama Alejandra Valdez De La
Bought by
Lama Carlos Merino De La
Purchase Details
Closed on
Mar 23, 2016
Sold by
Dela Lama Carlos Merino and De La Lama Alejandra Valdez
Bought by
Delalama Carlos Merino and Delalama Alejandra Valdez
Home Financials for this Owner
Home Financials are based on the most recent Mortgage that was taken out on this home.
Original Mortgage
$247,000
Outstanding Balance
$151,744
Interest Rate
3.65%
Mortgage Type
New Conventional
Estimated Equity
$626,222
Purchase Details
Closed on
Oct 17, 1991
Bought by
Delalama Carlos M Alejandra
Create a Home Valuation Report for This Property
The Home Valuation Report is an in-depth analysis detailing your home's value as well as a comparison with similar homes in the area
Home Values in the Area
Average Home Value in this Area
Purchase History
| Date | Buyer | Sale Price | Title Company |
|---|---|---|---|
| Lama Carlos M De La | -- | None Available | |
| Lama Carlos Merino De La | -- | None Available | |
| Delalama Carlos Merino | -- | First American Title Company | |
| Delalama Carlos M Alejandra | $192,500 | -- |
Source: Public Records
Mortgage History
| Date | Status | Borrower | Loan Amount |
|---|---|---|---|
| Open | Delalama Carlos Merino | $247,000 |
Source: Public Records
Tax History Compared to Growth
Tax History
| Year | Tax Paid | Tax Assessment Tax Assessment Total Assessment is a certain percentage of the fair market value that is determined by local assessors to be the total taxable value of land and additions on the property. | Land | Improvement |
|---|---|---|---|---|
| 2025 | $4,230 | $339,490 | $123,769 | $215,721 |
| 2024 | $4,230 | $332,835 | $121,343 | $211,492 |
| 2023 | $4,151 | $326,310 | $118,964 | $207,346 |
| 2022 | $4,029 | $319,913 | $116,632 | $203,281 |
| 2021 | $3,938 | $313,642 | $114,346 | $199,296 |
| 2020 | $3,851 | $310,427 | $113,174 | $197,253 |
| 2019 | $3,749 | $304,341 | $110,955 | $193,386 |
| 2018 | $3,760 | $298,375 | $108,780 | $189,595 |
| 2017 | $3,692 | $292,526 | $106,648 | $185,878 |
| 2016 | $3,589 | $286,791 | $104,557 | $182,234 |
| 2015 | $4,308 | $282,484 | $102,987 | $179,497 |
| 2014 | $4,246 | $276,951 | $100,970 | $175,981 |
Source: Public Records
Map
Nearby Homes
- 1415 Summit Dr
- 1386 Serena Cir Unit 2
- 1370 Callejon Palacios Unit 61
- 731 Baylor Ave
- 1529 Apache Dr Unit A
- 1579 Apache Dr Unit E
- 1532 Apache Dr Unit D
- 1654 Yale St
- 1079 Las Rosas Ct
- 1334 Ridgeview Way
- 1112 Camino Del Rey
- 1349 Ridgeview Way
- 728 Cardona Ave
- 1181 De Soto Ct Unit 54
- 713 Esla Dr
- 1236 El Cortez Ct
- 1153 Gustine St
- 1626 Coolsprings Ct
- 1270 El Cortez Ct Unit 213
- 1133 Carlos Canyon Dr
- 1358 Serena Cir Unit 2
- 1358 Serena Cir Unit 1
- 1351 Serena Cir Unit 3
- 1351 Serena Cir Unit 2
- 1351 Serena Cir Unit 1
- 1353 Serena Cir Unit 3
- 1353 Serena Cir Unit 2
- 1353 Serena Cir Unit 1
- 1357 Serena Cir Unit 2
- 1359 Serena Cir Unit 3
- 1359 Serena Cir Unit 2
- 1359 Serena Cir Unit 1
- 1354 Serena Cir
- 1356 Serena Cir Unit 1
- 1354 Serena Cir Unit 1
- 1354 Serena Cir Unit 2
- 1354 Serena Cir Unit 3
- 1356 Serena Cir Unit 2
- 1356 Serena Cir Unit 3
- 1353 Serena Circle #3