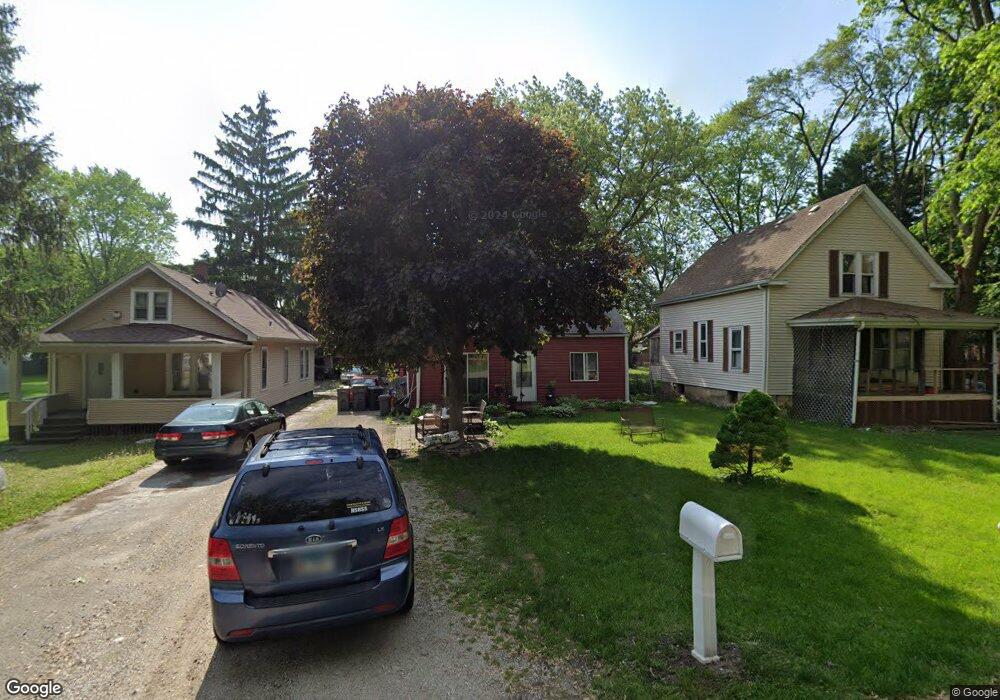
1359 Talma St Aurora, IL 60505
Estimated Value: $163,000 - $218,000
2
Beds
1
Bath
551
Sq Ft
$340/Sq Ft
Est. Value
About This Home
This home is located at 1359 Talma St, Aurora, IL 60505 and is currently estimated at $187,326, approximately $339 per square foot. 1359 Talma St is a home located in Kane County with nearby schools including Dieterich Elementary School, K D Waldo Middle School, and East Aurora High School.
Ownership History
Date
Name
Owned For
Owner Type
Purchase Details
Closed on
Sep 4, 2009
Sold by
Rios Francisco
Bought by
Barrios Denise
Current Estimated Value
Purchase Details
Closed on
Feb 17, 2005
Sold by
Portillo Omar
Bought by
Rios Francisco
Home Financials for this Owner
Home Financials are based on the most recent Mortgage that was taken out on this home.
Original Mortgage
$92,859
Interest Rate
7.9%
Mortgage Type
Purchase Money Mortgage
Purchase Details
Closed on
Nov 28, 2001
Sold by
Johnson Florence and Salazar Virginia
Bought by
Portillo Omar
Home Financials for this Owner
Home Financials are based on the most recent Mortgage that was taken out on this home.
Original Mortgage
$64,600
Interest Rate
6.68%
Purchase Details
Closed on
Nov 14, 2001
Sold by
Fifth Third Bank Chicago
Bought by
Johnson Florence
Home Financials for this Owner
Home Financials are based on the most recent Mortgage that was taken out on this home.
Original Mortgage
$64,600
Interest Rate
6.68%
Create a Home Valuation Report for This Property
The Home Valuation Report is an in-depth analysis detailing your home's value as well as a comparison with similar homes in the area
Home Values in the Area
Average Home Value in this Area
Purchase History
| Date | Buyer | Sale Price | Title Company |
|---|---|---|---|
| Barrios Denise | -- | None Available | |
| Rios Francisco | $98,000 | First American Title Ins Co | |
| Portillo Omar | $68,000 | -- | |
| Johnson Florence | -- | -- |
Source: Public Records
Mortgage History
| Date | Status | Borrower | Loan Amount |
|---|---|---|---|
| Previous Owner | Rios Francisco | $92,859 | |
| Previous Owner | Portillo Omar | $64,600 |
Source: Public Records
Tax History Compared to Growth
Tax History
| Year | Tax Paid | Tax Assessment Tax Assessment Total Assessment is a certain percentage of the fair market value that is determined by local assessors to be the total taxable value of land and additions on the property. | Land | Improvement |
|---|---|---|---|---|
| 2024 | $2,801 | $53,568 | $7,019 | $46,549 |
| 2023 | $2,532 | $47,862 | $6,271 | $41,591 |
| 2022 | $2,458 | $44,187 | $5,722 | $38,465 |
| 2021 | $2,140 | $37,176 | $5,327 | $31,849 |
| 2020 | $1,567 | $28,122 | $4,948 | $23,174 |
| 2019 | $1,523 | $26,055 | $4,584 | $21,471 |
| 2018 | $1,485 | $24,630 | $4,240 | $20,390 |
| 2017 | $1,450 | $22,693 | $3,907 | $18,786 |
| 2016 | $1,339 | $20,203 | $3,349 | $16,854 |
| 2015 | -- | $17,481 | $2,880 | $14,601 |
| 2014 | -- | $13,881 | $2,647 | $11,234 |
| 2013 | -- | $17,059 | $2,662 | $14,397 |
Source: Public Records
Map
Nearby Homes
- 1336 Douglas Ave Unit 13
- Lot 1 Douglas Ave
- 1150 Gates St
- 1440 Manning Ave
- 106 Hamlet Cir
- 1422 Manning Ave
- 1405 Manning Ave
- 825 Hinman St
- 1375 Manning Ave
- 421 Simms St
- 1342 Oak Ridge Ln
- 2071 Wiesbrook Dr
- 1707 Deer Run Dr
- 713 S 4th St
- 37 Fallcreek Cir
- 36 Fallcreek Cir Unit 35
- 735 Sexton St
- 633-635 S 4th St
- 170 Montgomery Rd
- 636 Bangs St