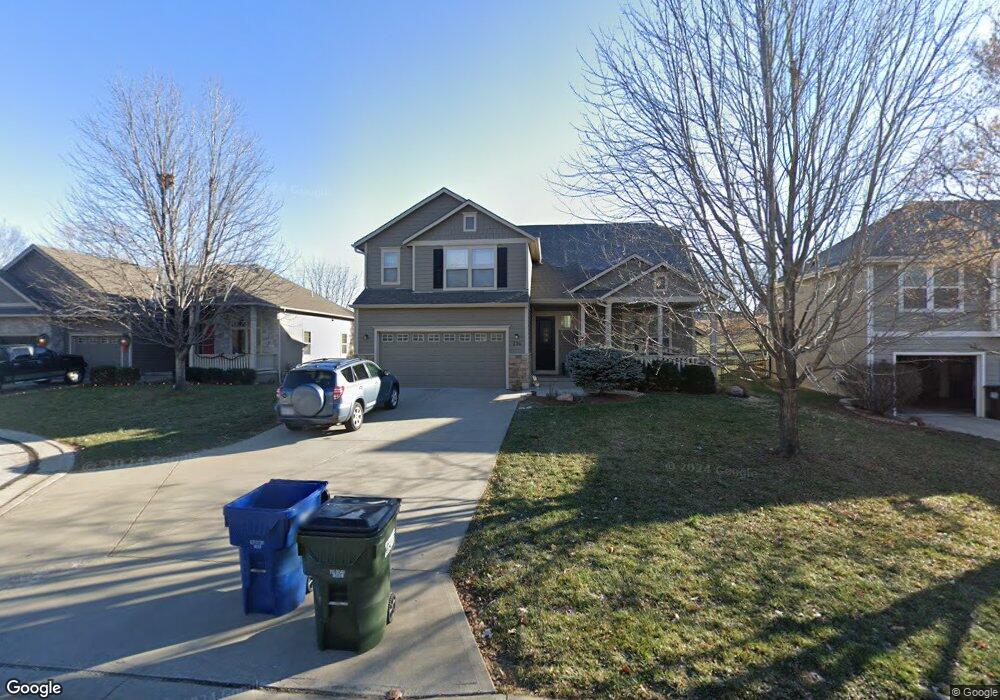
136 Aspen Ln Lawrence, KS 66049
Monterey NeighborhoodEstimated Value: $454,630 - $473,000
4
Beds
4
Baths
2,600
Sq Ft
$179/Sq Ft
Est. Value
About This Home
This home is located at 136 Aspen Ln, Lawrence, KS 66049 and is currently estimated at $465,543, approximately $179 per square foot. 136 Aspen Ln is a home located in Douglas County with nearby schools including Quail Run Elementary School, West Middle School, and Lawrence Free State High School.
Ownership History
Date
Name
Owned For
Owner Type
Purchase Details
Closed on
Dec 17, 2012
Sold by
Armey Robert and Armey Joy
Bought by
Weserman Vicki D
Current Estimated Value
Home Financials for this Owner
Home Financials are based on the most recent Mortgage that was taken out on this home.
Original Mortgage
$208,000
Outstanding Balance
$143,906
Interest Rate
3.34%
Mortgage Type
New Conventional
Estimated Equity
$321,637
Purchase Details
Closed on
Oct 26, 2007
Sold by
Armey Gemma
Bought by
Armey Robert and Armey Joy
Home Financials for this Owner
Home Financials are based on the most recent Mortgage that was taken out on this home.
Original Mortgage
$256,500
Interest Rate
6.37%
Mortgage Type
Purchase Money Mortgage
Purchase Details
Closed on
Aug 8, 2007
Sold by
Harris Residential Construction Inc
Bought by
Armey Gemma
Home Financials for this Owner
Home Financials are based on the most recent Mortgage that was taken out on this home.
Original Mortgage
$256,500
Interest Rate
6.69%
Mortgage Type
New Conventional
Create a Home Valuation Report for This Property
The Home Valuation Report is an in-depth analysis detailing your home's value as well as a comparison with similar homes in the area
Home Values in the Area
Average Home Value in this Area
Purchase History
| Date | Buyer | Sale Price | Title Company |
|---|---|---|---|
| Weserman Vicki D | -- | Kansas Secured Title | |
| Armey Robert | -- | Kansas Secured Title | |
| Armey Gemma | -- | Kansas Secured Title |
Source: Public Records
Mortgage History
| Date | Status | Borrower | Loan Amount |
|---|---|---|---|
| Open | Weserman Vicki D | $208,000 | |
| Previous Owner | Armey Robert | $256,500 | |
| Previous Owner | Armey Gemma | $256,500 |
Source: Public Records
Tax History Compared to Growth
Tax History
| Year | Tax Paid | Tax Assessment Tax Assessment Total Assessment is a certain percentage of the fair market value that is determined by local assessors to be the total taxable value of land and additions on the property. | Land | Improvement |
|---|---|---|---|---|
| 2025 | $6,162 | $51,670 | $8,625 | $43,045 |
| 2024 | $6,162 | $49,370 | $7,475 | $41,895 |
| 2023 | $6,053 | $46,897 | $6,900 | $39,997 |
| 2022 | $5,550 | $42,746 | $6,900 | $35,846 |
| 2021 | $4,874 | $36,432 | $5,980 | $30,452 |
| 2020 | $4,621 | $34,730 | $5,980 | $28,750 |
| 2019 | $4,554 | $34,270 | $5,060 | $29,210 |
| 2018 | $4,510 | $33,695 | $4,600 | $29,095 |
| 2017 | $4,397 | $32,488 | $4,600 | $27,888 |
| 2016 | $5,039 | $31,556 | $3,450 | $28,106 |
| 2015 | $4,871 | $30,004 | $3,450 | $26,554 |
| 2014 | $4,854 | $29,900 | $3,450 | $26,450 |
Source: Public Records
Map
Nearby Homes
- 127 Bramble Bend Ct
- 141 N Fall Creek Dr
- 145 N Fall Creek Dr
- 3712 Running Ridge Dr
- 3720 Running Ridge Dr
- 208 Fall Creek Dr
- 213 Stockade St
- 125 Sharon Dr
- 212 Stockade St
- 216 Stockade St
- 205 Knotted Bend Ct
- 3824 Stockade Ct
- 3708 Buck Brush Ct
- 3800 Stockade Ct
- 2 Fall Creek Rd
- 3 Fall Creek Rd
- 201 Fall Creek Rd
- 3719 Tucker Trail
- 204 Fall Creek Rd
- 208 Fall Creek Rd
- 142 Aspen Ln
- 130 Aspen Ln
- 148 Aspen Ln
- 154 Aspen Ln
- 137 Aspen Ln
- 115 Bramble Bend Ct
- 143 Aspen Ln
- 149 Aspen Ln
- 123 Bramble Bend Ct
- 160 Aspen Ln
- 155 Aspen Ln
- 3902 Tumbleweed Ct
- 100 Bramble Bend Ct
- 108 Bramble Bend Ct
- 161 Aspen Ln
- 3903 Tumbleweed Ct
- 104 Bramble Bend Ct
- 112 Bramble Bend Ct
- 109 Monterey Way
- 131 Bramble Bend Ct