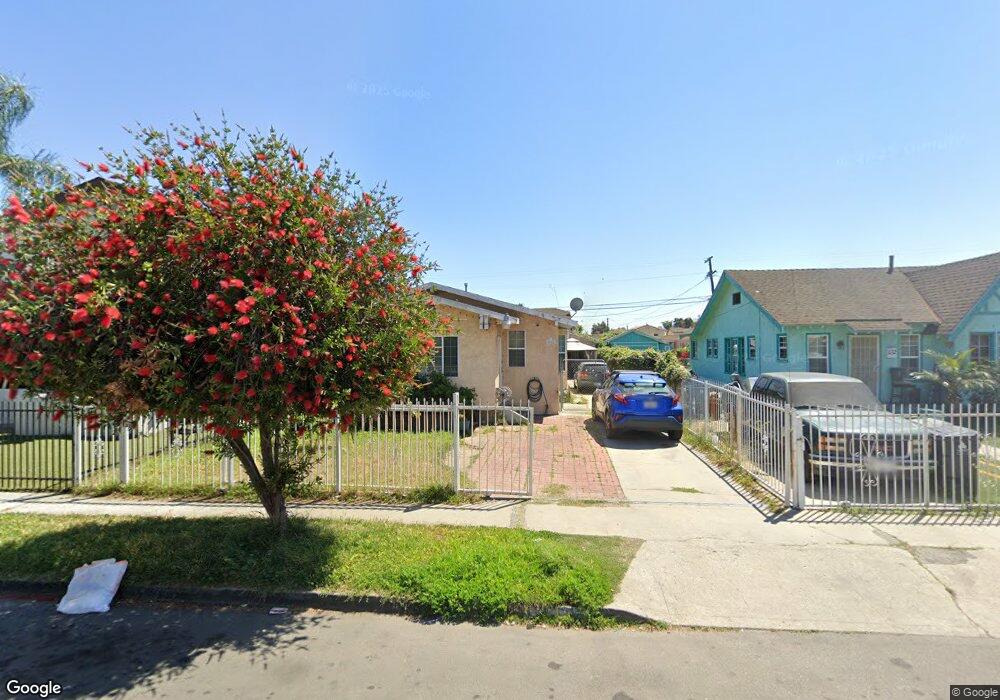
136 E 110th St Los Angeles, CA 90061
Broadway-Manchester NeighborhoodEstimated Value: $531,000 - $610,000
About This Home
This home is located at 136 E 110th St, Los Angeles, CA 90061 and is currently estimated at $573,689, approximately $648 per square foot. 136 E 110th St is a home located in Los Angeles County with nearby schools including One Hundred Seventh Street Elementary School, Samuel Gompers Middle School, and Alliance College-Ready Middle Academy No. 4.
Ownership History
Purchase Details
Purchase Details
Purchase Details
Home Financials for this Owner
Home Financials are based on the most recent Mortgage that was taken out on this home.Purchase Details
Home Financials for this Owner
Home Financials are based on the most recent Mortgage that was taken out on this home.Home Values in the Area
Average Home Value in this Area
Purchase History
We collect this data history from publicly available records. To have your information removed, we recommend requesting removal directly through your county’s website.
| Date | Buyer | Sale Price | Title Company |
|---|---|---|---|
| Galvan Maria L Hernandez | -- | None Listed On Document | |
| Galvan Victor | -- | None Available | |
| Galvan Victor | $110,000 | Gateway Title Company | |
| Trejo Salvador | -- | Gateway Title Company | |
| Trejo Salvador | $76,000 | Gateway Title Company |
Mortgage History
We collect this data history from publicly available records. To have your information removed, we recommend requesting removal directly through your county’s website.
| Date | Status | Borrower | Loan Amount |
|---|---|---|---|
| Previous Owner | Galvan Victor | $99,000 | |
| Previous Owner | Trejo Salvador | $60,000 |
Tax History
| Year | Tax Paid | Tax Assessment Tax Assessment Total Assessment is a certain percentage of the fair market value that is determined by local assessors to be the total taxable value of land and additions on the property. | Land | Improvement |
|---|---|---|---|---|
| 2025 | $2,356 | $162,477 | $102,217 | $60,260 |
| 2024 | $2,318 | $159,292 | $100,213 | $59,079 |
| 2023 | $2,277 | $156,170 | $98,249 | $57,921 |
| 2022 | $2,182 | $153,109 | $96,323 | $56,786 |
| 2021 | $2,152 | $150,108 | $94,435 | $55,673 |
| 2019 | $2,091 | $145,658 | $91,635 | $54,023 |
| 2018 | $1,978 | $142,803 | $89,839 | $52,964 |
| 2016 | $1,880 | $137,259 | $86,351 | $50,908 |
| 2015 | $1,850 | $135,198 | $85,054 | $50,144 |
| 2014 | $1,858 | $132,550 | $83,388 | $49,162 |
Map
- 10911 Main St
- 10909 Main St
- 10907 Main St
- 142 W 110th St
- 150 E 108th St
- 151 W 110th St
- 123 E 108th St
- 10811 S San Pedro St
- 10800 S San Pedro St
- 203 E 107th St
- 134 W 113th St
- 319 E 113th St
- 11154 S Broadway
- 204 E Imperial Hwy
- 11154 Towne Ave
- 210 W 113th St
- 11415 Link St
- 224 W 107th St
- 239 W 113th St
- 10515 S Main St
- 138 E 110th St
- 132 E 110th St
- 128 E 110th St
- 144 E 110th St
- 124 E 110th St
- 135 E 111th St
- 139 E 111th St
- 131 E 111th St
- 135 E 111th Place
- 146 E 110th St
- 145 E 111th St
- 127 E 111th St
- 120 E 110th St
- 147 E 111th St
- 125 E 111th St
- 135 E 110th St
- 139 E 110th St
- 125 E 111th Place
- 152 E 110th St
- 143 E 110th St
Ask me questions while you tour the home.