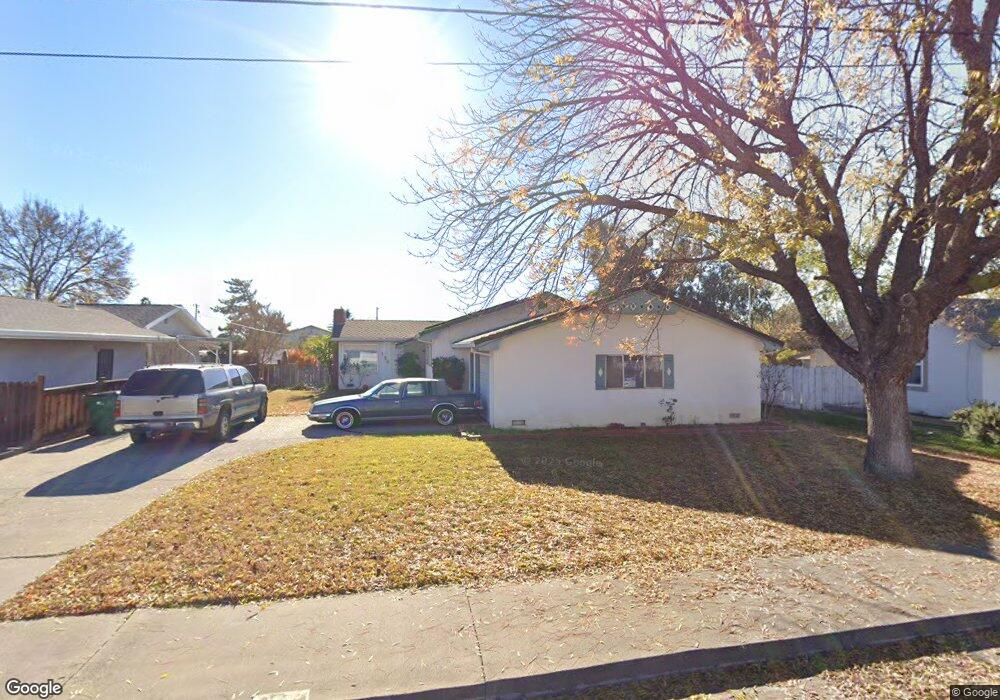
136 E Colusa St Orland, CA 95963
Estimated Value: $359,000 - $398,000
3
Beds
2
Baths
1,362
Sq Ft
$278/Sq Ft
Est. Value
About This Home
This home is located at 136 E Colusa St, Orland, CA 95963 and is currently estimated at $378,757, approximately $278 per square foot. 136 E Colusa St is a home located in Glenn County with nearby schools including Mill Street Elementary School, Fairview Elementary School, and Price Intermediate School.
Ownership History
Date
Name
Owned For
Owner Type
Purchase Details
Closed on
Aug 1, 2024
Sold by
Vargas Daniel Pena
Bought by
Vargas Depena Susana
Current Estimated Value
Purchase Details
Closed on
Oct 29, 2018
Sold by
Thomas Larry S and Thomas Katherine J
Bought by
Vargas Daniel Pena
Home Financials for this Owner
Home Financials are based on the most recent Mortgage that was taken out on this home.
Original Mortgage
$235,467
Interest Rate
4.6%
Mortgage Type
New Conventional
Purchase Details
Closed on
Dec 18, 2013
Sold by
M Thomas Llc
Bought by
Thomas Larry S and Thomas Katherine J
Purchase Details
Closed on
Mar 25, 2013
Sold by
Schmidt Susan Lynn and Thomas Larry Steven
Bought by
M Thomas Llc
Purchase Details
Closed on
Aug 30, 2012
Sold by
Schmidt Susan Lynn and Thomas Larry Steven
Bought by
Schmidt Susan Lynn and Thomas Larry Steven
Create a Home Valuation Report for This Property
The Home Valuation Report is an in-depth analysis detailing your home's value as well as a comparison with similar homes in the area
Purchase History
| Date | Buyer | Sale Price | Title Company |
|---|---|---|---|
| Vargas Depena Susana | -- | None Listed On Document | |
| Vargas Daniel Pena | $243,000 | Bidwell Title & Escrow Co | |
| Thomas Larry S | $175,000 | Bidwell Title & Escrow Co | |
| Schmidt Susan Lynn | -- | Bidwell Title & Escrow Co | |
| Zatz Lisa M | -- | Bidwell Title & Escrow Co | |
| M Thomas Llc | -- | None Available | |
| Schmidt Susan Lynn | -- | None Available |
Source: Public Records
Mortgage History
| Date | Status | Borrower | Loan Amount |
|---|---|---|---|
| Previous Owner | Vargas Daniel Pena | $235,467 |
Source: Public Records
Tax History
| Year | Tax Paid | Tax Assessment Tax Assessment Total Assessment is a certain percentage of the fair market value that is determined by local assessors to be the total taxable value of land and additions on the property. | Land | Improvement |
|---|---|---|---|---|
| 2025 | $2,960 | $385,000 | $55,000 | $330,000 |
| 2024 | $2,960 | $265,478 | $49,212 | $216,266 |
| 2023 | $2,899 | $260,274 | $48,248 | $212,026 |
| 2022 | $2,844 | $255,171 | $47,302 | $207,869 |
| 2021 | $2,813 | $250,169 | $46,375 | $203,794 |
| 2020 | $2,811 | $247,605 | $45,900 | $201,705 |
| 2019 | $2,790 | $242,750 | $45,000 | $197,750 |
| 2018 | $1,532 | $137,198 | $27,521 | $109,677 |
| 2017 | $1,590 | $134,509 | $26,982 | $107,527 |
| 2016 | $1,494 | $131,872 | $26,453 | $105,419 |
| 2015 | $1,472 | $129,892 | $26,056 | $103,836 |
| 2014 | $1,444 | $127,348 | $25,546 | $101,802 |
Source: Public Records
Map
Nearby Homes
- 128 E Colusa St
- 142 E Colusa St
- 120 E Colusa St
- 146 E Colusa St
- 131 E Mill St
- 116 E Colusa St
- 154 E Colusa St
- 145 E Mill St
- 145 E Colusa St
- 139 E Colusa St
- 133 E Colusa St
- 119 E Mill St
- 814 Woodward Ave
- 119 E Colusa St
- 820 Woodward Ave
- 106 E Colusa St
- 808 Woodward Ave
- 149 E Mill St
- 804 Woodward Ave
- 163 E Colusa St
Your Personal Tour Guide
Ask me questions while you tour the home.