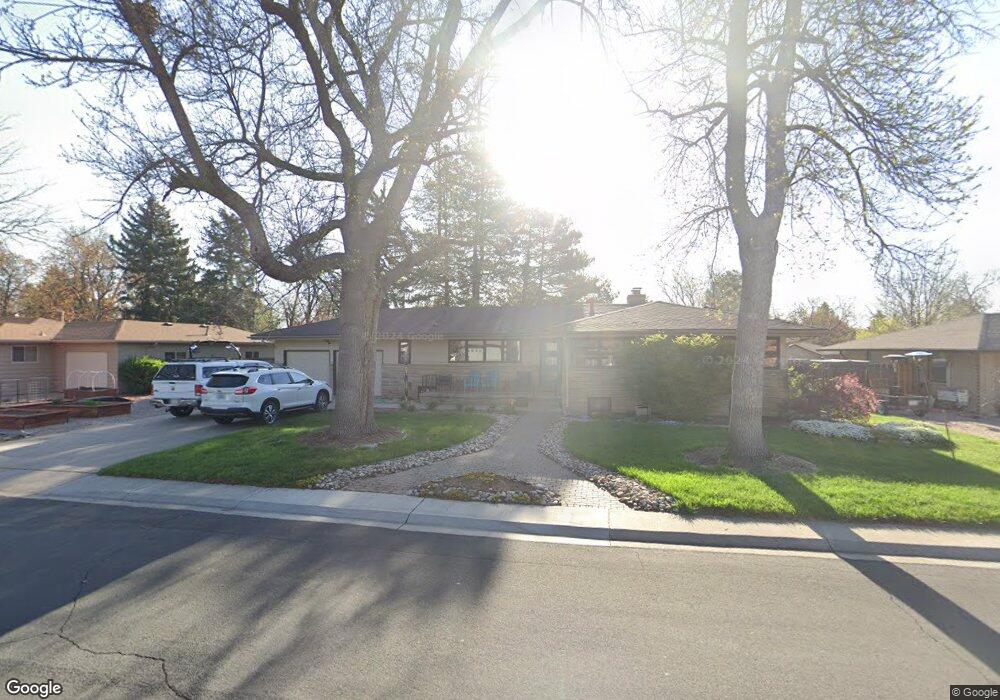
136 E Harvard St Fort Collins, CO 80525
South College Heights NeighborhoodEstimated Value: $585,000 - $794,000
4
Beds
2
Baths
2,365
Sq Ft
$280/Sq Ft
Est. Value
About This Home
This home is located at 136 E Harvard St, Fort Collins, CO 80525 and is currently estimated at $662,750, approximately $280 per square foot. 136 E Harvard St is a home located in Larimer County with nearby schools including O'Dea Elementary School, Lesher Middle School, and Fort Collins High School.
Ownership History
Date
Name
Owned For
Owner Type
Purchase Details
Closed on
May 1, 2015
Sold by
Kwan Gayle K
Bought by
Morehouse Mark A and Morehouse Ginger A
Current Estimated Value
Home Financials for this Owner
Home Financials are based on the most recent Mortgage that was taken out on this home.
Original Mortgage
$304,000
Outstanding Balance
$231,305
Interest Rate
3.74%
Mortgage Type
New Conventional
Estimated Equity
$431,445
Purchase Details
Closed on
Sep 9, 2011
Sold by
Kwan Gayle K
Bought by
Kwan Gerald
Purchase Details
Closed on
Jan 14, 2005
Sold by
Sylvester C Maier Living Trust
Bought by
Kwan Gayle K and Kwan Gerald
Home Financials for this Owner
Home Financials are based on the most recent Mortgage that was taken out on this home.
Original Mortgage
$198,800
Interest Rate
5.8%
Mortgage Type
Fannie Mae Freddie Mac
Purchase Details
Closed on
Jul 1, 1994
Sold by
Hall Janet
Bought by
Maier Almina A Living Trust
Create a Home Valuation Report for This Property
The Home Valuation Report is an in-depth analysis detailing your home's value as well as a comparison with similar homes in the area
Home Values in the Area
Average Home Value in this Area
Purchase History
| Date | Buyer | Sale Price | Title Company |
|---|---|---|---|
| Morehouse Mark A | $383,800 | Land Title Guarantee Company | |
| Kwan Gerald | -- | None Available | |
| Kwan Gayle K | $248,500 | None Available | |
| Maier Almina A Living Trust | $140,500 | -- |
Source: Public Records
Mortgage History
| Date | Status | Borrower | Loan Amount |
|---|---|---|---|
| Open | Morehouse Mark A | $304,000 | |
| Previous Owner | Kwan Gayle K | $198,800 |
Source: Public Records
Tax History
| Year | Tax Paid | Tax Assessment Tax Assessment Total Assessment is a certain percentage of the fair market value that is determined by local assessors to be the total taxable value of land and additions on the property. | Land | Improvement |
|---|---|---|---|---|
| 2025 | $4,264 | $40,475 | $2,500 | $37,975 |
| 2024 | $4,057 | $48,126 | $2,680 | $45,446 |
| 2022 | $3,314 | $35,098 | $2,780 | $32,318 |
| 2021 | $3,349 | $36,108 | $2,860 | $33,248 |
| 2020 | $3,139 | $33,548 | $2,860 | $30,688 |
| 2019 | $3,152 | $33,548 | $2,860 | $30,688 |
| 2018 | $2,532 | $27,778 | $2,880 | $24,898 |
| 2017 | $2,523 | $27,778 | $2,880 | $24,898 |
| 2016 | $2,192 | $24,007 | $3,184 | $20,823 |
| 2015 | $1,941 | $21,420 | $3,180 | $18,240 |
| 2014 | $1,705 | $18,690 | $3,180 | $15,510 |
Source: Public Records
Map
Nearby Homes
- 127 E Harvard St
- 149 Yale Ave
- 412 Baylor St
- 301 E Thunderbird Dr
- 412 Cornell Ave
- 2725 Harvard St Unit 5
- 2701 Harvard St Unit A2
- 2800 Tulane Dr
- 2025 Mathews St Unit B1
- 2025 Mathews St Unit D1
- 616 Tulane Dr
- 2400 Stover St
- 2800 Ringneck Dr
- 2701 Stover St Unit C10
- 705 E Drake Rd Unit P25
- 2901 Eagle Dr
- 2905 Eagle Dr
- 801 E Drake Rd Unit K53
- 809 E Drake Rd Unit B112
- 1933 Northerland Dr
- 132 E Harvard St
- 157 Yale Ave
- 140 E Harvard St
- 153 Yale Ave
- 131 E Harvard St
- 128 E Harvard St
- 135 E Harvard St
- 139 E Harvard St
- 123 E Harvard St
- 124 E Harvard St
- 141 Yale Ave
- 164 Yale Ave
- 160 Yale Ave
- 168 Yale Ave
- 156 Yale Ave
- 2520 S College Ave
- 119 E Harvard St
- 143 E Harvard St
- 2516 S College Ave
- 2524 S College Ave
Your Personal Tour Guide
Ask me questions while you tour the home.