Estimated Value: $842,263 - $983,000
4
Beds
2
Baths
1,288
Sq Ft
$700/Sq Ft
Est. Value
About This Home
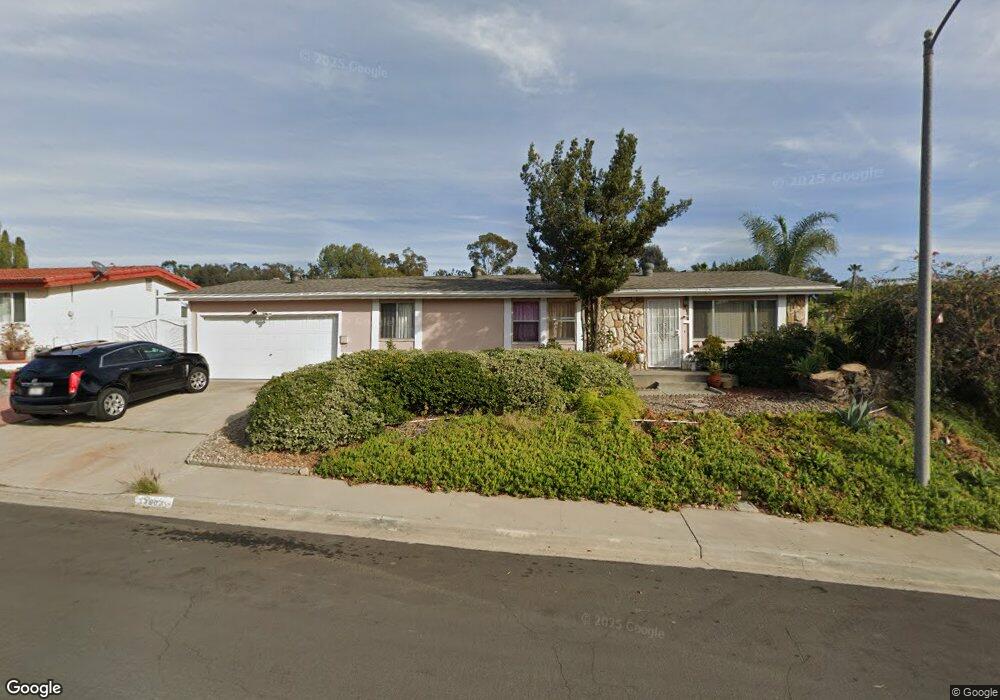
This home is located at 13607 Utopia Rd, Poway, CA 92064 and is currently estimated at $902,066, approximately $700 per square foot. 13607 Utopia Rd is a home located in San Diego County with nearby schools including Pomerado Elementary, Meadowbrook Middle, and Poway High.
Ownership History
Date
Name
Owned For
Owner Type
Purchase Details
Closed on
Jun 23, 2025
Sold by
Babaie Amin Esmail and Azam Esmaeili Azam
Bought by
Esmail Babaie Amin And Azam Esmaeili Living T and Amin
Current Estimated Value
Purchase Details
Closed on
Jan 31, 2002
Sold by
Allen Russell S
Bought by
Tong Pansy S
Home Financials for this Owner
Home Financials are based on the most recent Mortgage that was taken out on this home.
Original Mortgage
$196,800
Interest Rate
6.94%
Purchase Details
Closed on
Jan 8, 2002
Sold by
Tong Peter S and Tong Pansy S
Bought by
Amin Esmail B and Esmaelli Azam
Home Financials for this Owner
Home Financials are based on the most recent Mortgage that was taken out on this home.
Original Mortgage
$196,800
Interest Rate
6.94%
Purchase Details
Closed on
Mar 1, 1990
Purchase Details
Closed on
May 31, 1985
Create a Home Valuation Report for This Property
The Home Valuation Report is an in-depth analysis detailing your home's value as well as a comparison with similar homes in the area
Home Values in the Area
Average Home Value in this Area
Purchase History
| Date | Buyer | Sale Price | Title Company |
|---|---|---|---|
| Esmail Babaie Amin And Azam Esmaeili Living T | -- | None Listed On Document | |
| Tong Pansy S | -- | United Title Company | |
| Tong Peter S | -- | United Title Company | |
| Amin Esmail B | $246,000 | United Title Company | |
| -- | $157,000 | -- | |
| -- | $93,900 | -- |
Source: Public Records
Mortgage History
| Date | Status | Borrower | Loan Amount |
|---|---|---|---|
| Previous Owner | Amin Esmail B | $196,800 | |
| Closed | Amin Esmail B | $24,600 |
Source: Public Records
Tax History
| Year | Tax Paid | Tax Assessment Tax Assessment Total Assessment is a certain percentage of the fair market value that is determined by local assessors to be the total taxable value of land and additions on the property. | Land | Improvement |
|---|---|---|---|---|
| 2025 | $4,016 | $363,402 | $214,202 | $149,200 |
| 2024 | $4,016 | $356,277 | $210,002 | $146,275 |
| 2023 | $3,930 | $349,292 | $205,885 | $143,407 |
| 2022 | $3,864 | $342,445 | $201,849 | $140,596 |
| 2021 | $3,813 | $335,732 | $197,892 | $137,840 |
| 2020 | $3,762 | $332,290 | $195,863 | $136,427 |
| 2019 | $3,665 | $325,775 | $192,023 | $133,752 |
| 2018 | $3,562 | $319,388 | $188,258 | $131,130 |
| 2017 | $170 | $313,126 | $184,567 | $128,559 |
| 2016 | $3,395 | $306,988 | $180,949 | $126,039 |
| 2015 | $3,345 | $302,377 | $178,231 | $124,146 |
| 2014 | $3,266 | $296,455 | $174,740 | $121,715 |
Source: Public Records
Map
Nearby Homes
- 13641 Carriage Rd
- 12939 Cree Ct
- 12851 Papago Dr
- 12739 Papago Dr
- 13442 Mountainside Dr
- 12614 Orohaven Ln
- 12719 Robison Blvd Unit 18
- 13056 Poway Rd
- 13650 Mulberry Tree Ct Unit 167
- 13824 Powers Rd
- 12450 Robison Blvd
- 1/2 Poway Rd
- 12834 Rockwell Ct
- 13087 Olympus Cir Unit 2
- 13085 Olympus Cir Unit 1
- 12885 Rockwell Ct
- 14109 Arbolitos Dr
- 13254 Powers Ct
- 13619 Sycamore Tree Ln
- 12953 Carriage Rd
- 13608 Carriage Rd
- 13615 Utopia Rd
- 13616 Carriage Rd
- 13606 Utopia Rd
- 13547 Utopia Rd
- 13602 Utopia Rd
- 13614 Utopia Rd
- 13550 Carriage Rd
- 13623 Utopia Rd
- 13626 Carriage Rd
- 13548 Utopia Rd
- 13633 Silver Lake Dr
- 13625 Silver Lake Dr
- 13539 Utopia Rd
- 13538 Carriage Rd
- 13609 Carriage Rd
- 13601 Carriage Rd
- 13631 Utopia Rd
- 13641 Silver Lake Dr
- 13630 Utopia Rd
Your Personal Tour Guide
Ask me questions while you tour the home.