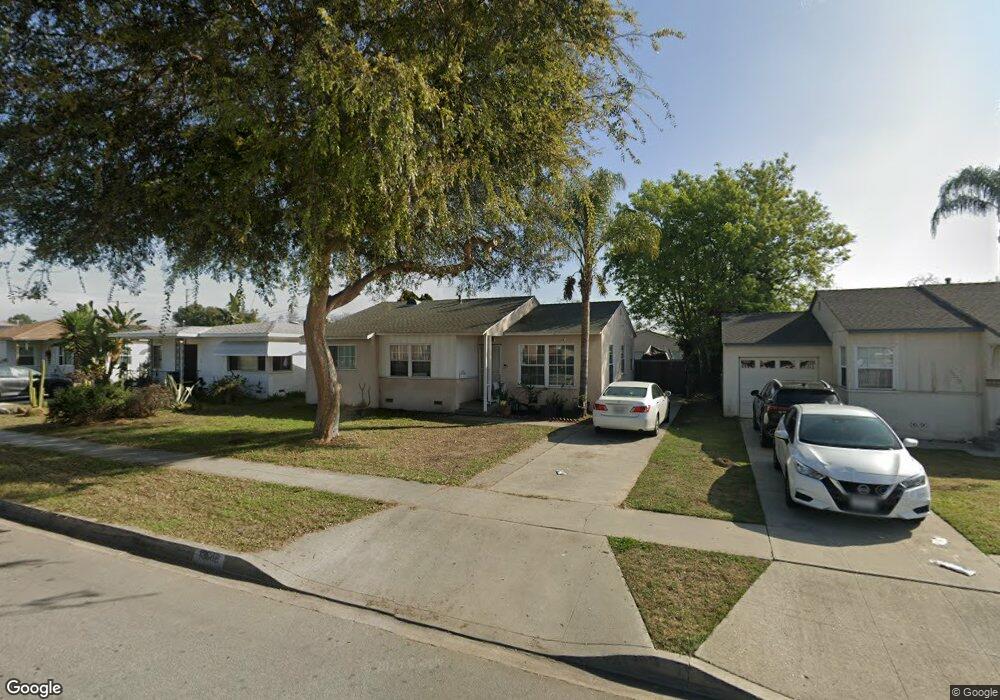
13608 Charlemagne Ave Bellflower, CA 90706
Estimated Value: $740,474 - $810,000
3
Beds
1
Bath
1,125
Sq Ft
$700/Sq Ft
Est. Value
About This Home
This home is located at 13608 Charlemagne Ave, Bellflower, CA 90706 and is currently estimated at $787,119, approximately $699 per square foot. 13608 Charlemagne Ave is a home located in Los Angeles County with nearby schools including Lewis Elementary School, Sussman Middle School, and Downey High School.
Ownership History
Date
Name
Owned For
Owner Type
Purchase Details
Closed on
Sep 24, 2012
Sold by
Nelson Mark A
Bought by
Nelson Rod A
Current Estimated Value
Purchase Details
Closed on
Oct 15, 2007
Sold by
Nelson Richard A
Bought by
Nelson Richard A and Sub Trust A
Purchase Details
Closed on
Jan 19, 1999
Sold by
Nelson Richard A
Bought by
Nelson Richard A and Nelson Gloria T
Create a Home Valuation Report for This Property
The Home Valuation Report is an in-depth analysis detailing your home's value as well as a comparison with similar homes in the area
Home Values in the Area
Average Home Value in this Area
Purchase History
| Date | Buyer | Sale Price | Title Company |
|---|---|---|---|
| Nelson Rod A | -- | None Available | |
| Nelson Mark A | -- | None Available | |
| Nelson Richard A | -- | None Available | |
| Nelson Richard A | -- | -- |
Source: Public Records
Tax History Compared to Growth
Tax History
| Year | Tax Paid | Tax Assessment Tax Assessment Total Assessment is a certain percentage of the fair market value that is determined by local assessors to be the total taxable value of land and additions on the property. | Land | Improvement |
|---|---|---|---|---|
| 2025 | $1,338 | $65,890 | $28,652 | $37,238 |
| 2024 | $1,338 | $64,599 | $28,091 | $36,508 |
| 2023 | $1,305 | $63,334 | $27,541 | $35,793 |
| 2022 | $1,255 | $62,093 | $27,001 | $35,092 |
| 2021 | $1,229 | $60,876 | $26,472 | $34,404 |
| 2019 | $1,202 | $59,073 | $25,688 | $33,385 |
| 2018 | $1,499 | $57,916 | $25,185 | $32,731 |
| 2016 | $1,043 | $55,669 | $24,208 | $31,461 |
| 2015 | $1,029 | $54,834 | $23,845 | $30,989 |
| 2014 | $1,171 | $53,760 | $23,378 | $30,382 |
Source: Public Records
Map
Nearby Homes
- 13522 Ardis Ave
- 9488 Foster Rd
- 9494 Van Ruiten St
- 9564 Rosecrans Ave
- 9837 Belfair St
- 9226 Foster Rd
- 12843 Columbia Way
- 12707 Glenshire Rd
- 13742 Hanwell Ave
- 9545 Heiner St
- 9127 Hargill St
- 13440 Lakewood Blvd Unit 99
- 13440 Lakewood Blvd Unit 98
- 13440 Lakewood Blvd Unit 97
- 9003 Mapleside St
- 9229 Mandale St
- 14716 Leahy Ave
- 13137 Faust Ave
- 14002 Bergen Ave
- 10207 Branscomb St
- 13602 Charlemagne Ave
- 13612 Charlemagne Ave
- 13432 Charlemagne Ave
- 13618 Charlemagne Ave
- 13509 Ardis Ave
- 13503 Ardis Ave
- 13513 Ardis Ave
- 13426 Charlemagne Ave
- 13622 Charlemagne Ave
- 13429 Ardis Ave
- 13607 Charlemagne Ave
- 13519 Ardis Ave
- 13611 Charlemagne Ave
- 13601 Charlemagne Ave
- 13423 Ardis Ave
- 13617 Charlemagne Ave
- 13431 Charlemagne Ave
- 13422 Charlemagne Ave
- 13628 Charlemagne Ave
- 13523 Ardis Ave