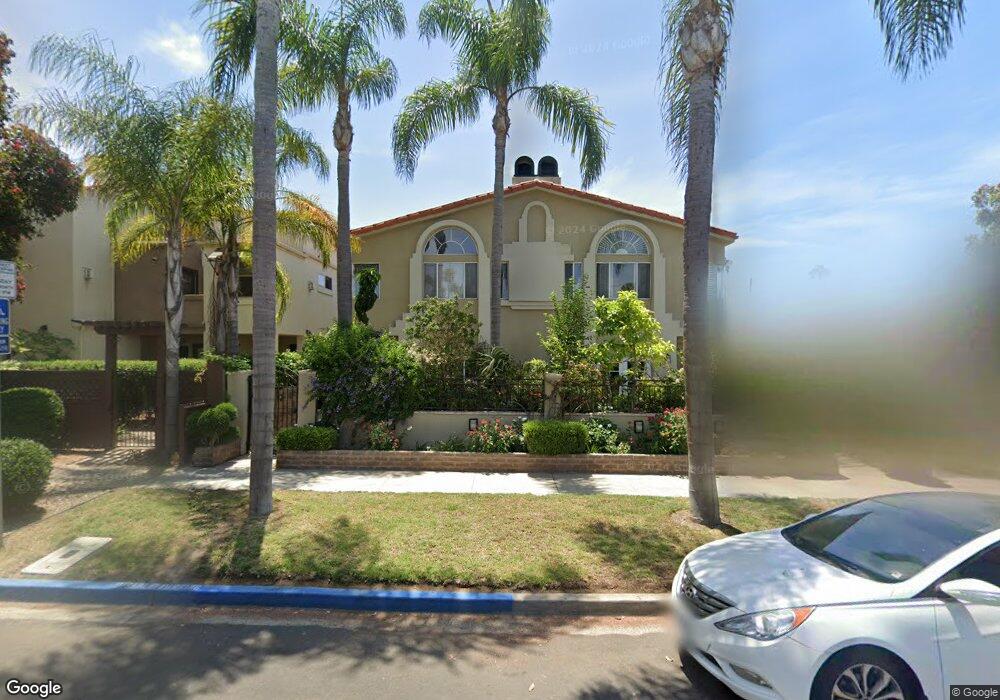
1361 Hornblend St San Diego, CA 92109
Pacific Beach NeighborhoodEstimated Value: $1,154,573 - $1,249,000
3
Beds
4
Baths
1,504
Sq Ft
$789/Sq Ft
Est. Value
About This Home
This home is located at 1361 Hornblend St, San Diego, CA 92109 and is currently estimated at $1,187,143, approximately $789 per square foot. 1361 Hornblend St is a home located in San Diego County with nearby schools including Pacific Beach Elementary School, Pacific Beach Middle, and Mission Bay High School.
Ownership History
Date
Name
Owned For
Owner Type
Purchase Details
Closed on
Jul 14, 2009
Sold by
Veltmann Jolie A
Bought by
Hayden Barry
Current Estimated Value
Home Financials for this Owner
Home Financials are based on the most recent Mortgage that was taken out on this home.
Original Mortgage
$387,075
Outstanding Balance
$250,826
Interest Rate
5.17%
Mortgage Type
Purchase Money Mortgage
Estimated Equity
$936,317
Purchase Details
Closed on
Aug 1, 2006
Sold by
Veltmann James S and Veltmann Jolie A
Bought by
Veltmann James S and Veltmann Jolie A
Purchase Details
Closed on
Sep 4, 2002
Sold by
Veltmann James S
Bought by
Veltmann James S and Veltmann Jolie A
Purchase Details
Closed on
Jul 11, 1997
Sold by
Veltmann Jolie
Bought by
Veltmann James Scott
Home Financials for this Owner
Home Financials are based on the most recent Mortgage that was taken out on this home.
Original Mortgage
$152,600
Interest Rate
7.54%
Purchase Details
Closed on
May 22, 1991
Create a Home Valuation Report for This Property
The Home Valuation Report is an in-depth analysis detailing your home's value as well as a comparison with similar homes in the area
Home Values in the Area
Average Home Value in this Area
Purchase History
| Date | Buyer | Sale Price | Title Company |
|---|---|---|---|
| Hayden Barry | $516,500 | First American Title Company | |
| Veltmann James S | -- | None Available | |
| Veltmann James S | -- | -- | |
| Veltmann James Scott | -- | Guardian Title Company | |
| Veltmann James Scott | $203,500 | Guardian Title Company | |
| -- | $231,000 | -- |
Source: Public Records
Mortgage History
| Date | Status | Borrower | Loan Amount |
|---|---|---|---|
| Open | Hayden Barry | $387,075 | |
| Previous Owner | Veltmann James Scott | $152,600 |
Source: Public Records
Tax History Compared to Growth
Tax History
| Year | Tax Paid | Tax Assessment Tax Assessment Total Assessment is a certain percentage of the fair market value that is determined by local assessors to be the total taxable value of land and additions on the property. | Land | Improvement |
|---|---|---|---|---|
| 2025 | $8,053 | $666,174 | $472,431 | $193,743 |
| 2024 | $8,053 | $653,113 | $463,168 | $189,945 |
| 2023 | $7,875 | $640,308 | $454,087 | $186,221 |
| 2022 | $7,666 | $627,754 | $445,184 | $182,570 |
| 2021 | $7,614 | $615,446 | $436,455 | $178,991 |
| 2020 | $7,522 | $609,136 | $431,980 | $177,156 |
| 2019 | $7,388 | $597,193 | $423,510 | $173,683 |
| 2018 | $6,907 | $585,484 | $415,206 | $170,278 |
| 2017 | $80 | $574,005 | $407,065 | $166,940 |
| 2016 | $6,636 | $562,751 | $399,084 | $163,667 |
| 2015 | $6,539 | $554,299 | $393,090 | $161,209 |
| 2014 | $6,436 | $543,442 | $385,390 | $158,052 |
Source: Public Records
Map
Nearby Homes
- 1434-44 Garnet Ave
- 1361 Felspar St Unit 7
- 1270 Emerald St
- 4135 Fanuel St
- 1220 Emerald St
- 1278 Pacific Beach Dr Unit 3
- 1122 Oliver Ave Unit U4
- 4071 Riviera Dr
- 4073 Riviera Dr
- 1152-54 Pacific Beach Dr
- 1733 Hornblend St
- 1221 Parker Place Unit 15
- 4733 Ingraham St
- 4037 Haines St
- 1807 Grand Ave
- 4053-55 Jewell St
- 1885 Diamond St Unit 2-235
- 1885 Diamond St Unit 329
- 1885 Diamond St Unit 2-234
- 3945 Haines St
- 1353 Hornblend St
- 1359 Hornblend St Unit L4
- 1357 Hornblend St Unit L2
- 1365 Hornblend St
- 1371 Hornblend St
- 1367 Hornblend St
- 1363 Hornblend St Unit L1
- 1349 Hornblend St
- 4428-44 Gresham St
- 4428 Gresham St
- 4428 Gresham St Unit 44
- 1345 Hornblend St Unit 47
- 1345-47 Hornblend St
- 4418 Gresham St
- 1346-74 Grand Ave
- 1346 Grand Ave
- 1346 Grand Ave
- 1335 Hornblend St
- 1382 Grand Ave
- 4410 Gresham St