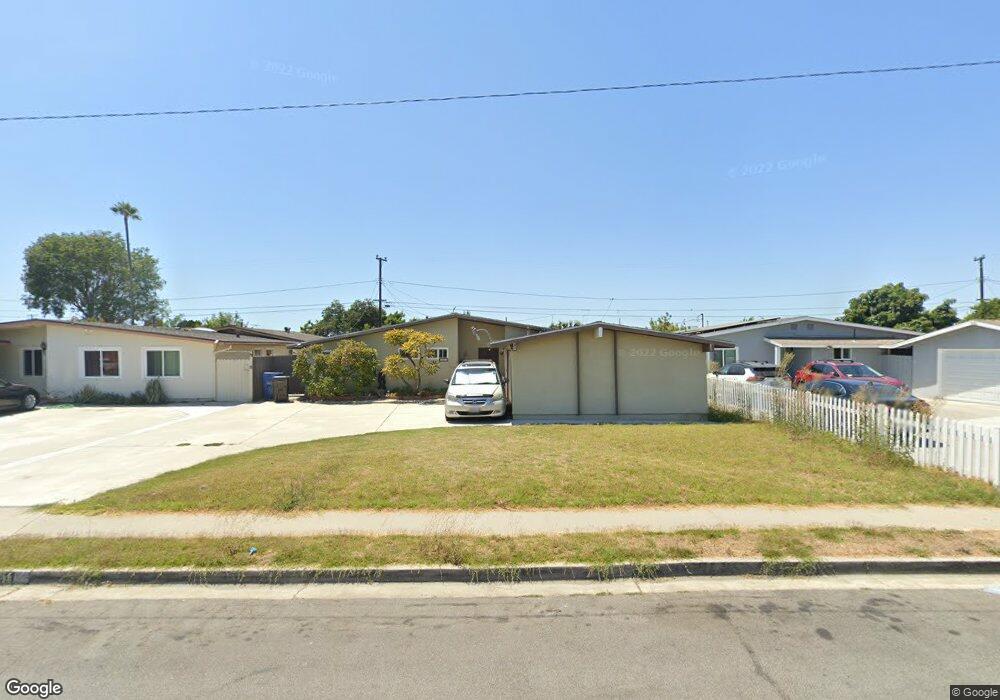
13611 Olympus Dr Westminster, CA 92683
Estimated Value: $895,026 - $1,039,000
3
Beds
2
Baths
1,171
Sq Ft
$846/Sq Ft
Est. Value
About This Home
This home is located at 13611 Olympus Dr, Westminster, CA 92683 and is currently estimated at $990,507, approximately $845 per square foot. 13611 Olympus Dr is a home located in Orange County with nearby schools including Fryberger Elementary, Johnson Middle, and Westminster High School.
Ownership History
Date
Name
Owned For
Owner Type
Purchase Details
Closed on
Oct 8, 2021
Sold by
Truong Tuong Manh
Bought by
Pham Vannie
Current Estimated Value
Purchase Details
Closed on
Feb 19, 2007
Sold by
Truong Tuong Manh
Bought by
Truong Tuong M and Pham Vannie
Purchase Details
Closed on
Jun 3, 1998
Sold by
Pham Vannie
Bought by
Truong Tuong Manh
Home Financials for this Owner
Home Financials are based on the most recent Mortgage that was taken out on this home.
Original Mortgage
$122,250
Interest Rate
7.17%
Purchase Details
Closed on
May 19, 1998
Sold by
Alberto Martinez and Alberto Dalida
Bought by
Truong Tuong Manh
Home Financials for this Owner
Home Financials are based on the most recent Mortgage that was taken out on this home.
Original Mortgage
$122,250
Interest Rate
7.17%
Create a Home Valuation Report for This Property
The Home Valuation Report is an in-depth analysis detailing your home's value as well as a comparison with similar homes in the area
Home Values in the Area
Average Home Value in this Area
Purchase History
| Date | Buyer | Sale Price | Title Company |
|---|---|---|---|
| Pham Vannie | -- | -- | |
| Truong Tuong M | -- | None Available | |
| Truong Tuong Manh | -- | Chicago Title Insurance Co | |
| Truong Tuong Manh | $163,000 | Chicago Title Insurance Co |
Source: Public Records
Mortgage History
| Date | Status | Borrower | Loan Amount |
|---|---|---|---|
| Previous Owner | Truong Tuong Manh | $122,250 |
Source: Public Records
Tax History
| Year | Tax Paid | Tax Assessment Tax Assessment Total Assessment is a certain percentage of the fair market value that is determined by local assessors to be the total taxable value of land and additions on the property. | Land | Improvement |
|---|---|---|---|---|
| 2025 | $3,533 | $260,261 | $190,812 | $69,449 |
| 2024 | $3,533 | $255,158 | $187,070 | $68,088 |
| 2023 | $3,414 | $250,155 | $183,402 | $66,753 |
| 2022 | $3,357 | $245,250 | $179,805 | $65,445 |
| 2021 | $3,269 | $240,442 | $176,280 | $64,162 |
| 2020 | $3,233 | $237,977 | $174,472 | $63,505 |
| 2019 | $3,201 | $233,311 | $171,051 | $62,260 |
| 2018 | $3,199 | $228,737 | $167,697 | $61,040 |
| 2017 | $3,089 | $224,252 | $164,408 | $59,844 |
| 2016 | $3,001 | $219,855 | $161,184 | $58,671 |
| 2015 | $2,953 | $216,553 | $158,763 | $57,790 |
| 2014 | $2,816 | $212,312 | $155,654 | $56,658 |
Source: Public Records
Map
Nearby Homes
- 6751 Klondike Ave
- 6632 Trask Ave
- 13942 Locust St
- 14101 Rondeau St
- 13161 Summit Cir
- 14116 Rondeau St
- 13622 Illinois St
- 7106 Brentwood Ln
- 6282 Cheyenne Dr
- 13822 Olive St
- 6216 Hefley St Unit 3
- 7161 Main St
- 14281 Edwards St
- 6091 Navajo Rd
- 6071 Modoc Rd
- 7603 23rd St
- 14260 Village Way Unit 23
- 13523 Cobblestone Ln
- 13036 Springarden Ln
- 6272 Chinook Ave
- 13601 Olympus Dr
- 13621 Olympus Dr
- 13612 Siskiyou St
- 13591 Olympus Dr
- 13631 Olympus Dr
- 13602 Siskiyou St
- 13622 Siskiyou St
- 13612 Olympus Dr
- 13632 Siskiyou St
- 13592 Siskiyou St
- 13622 Olympus Dr
- 13602 Olympus Dr
- 13641 Olympus Dr
- 13581 Olympus Dr
- 13592 Olympus Dr
- 13632 Olympus Dr
- 13642 Siskiyou St
- 13582 Siskiyou St
- 13651 Olympus Dr
- 13571 Olympus Dr
Your Personal Tour Guide
Ask me questions while you tour the home.