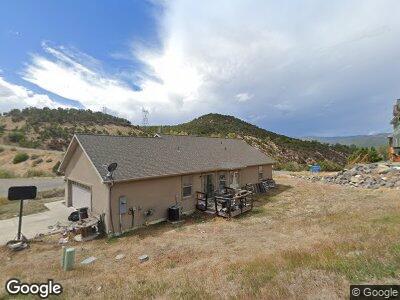
13613 Landsend Mountain Ln Unit Lot 1, Block 1 Hidde Paonia, CO 81428
Estimated Value: $422,000 - $490,000
3
Beds
2
Baths
1,514
Sq Ft
$309/Sq Ft
Est. Value
About This Home
This home is located at 13613 Landsend Mountain Ln Unit Lot 1, Block 1 Hidde, Paonia, CO 81428 and is currently estimated at $467,299, approximately $308 per square foot. 13613 Landsend Mountain Ln Unit Lot 1, Block 1 Hidde is a home located in Delta County with nearby schools including Paonia Elementary School, Paonia High School, and North Fork High School.
Ownership History
Date
Name
Owned For
Owner Type
Purchase Details
Closed on
Jun 12, 2015
Sold by
The Streza Corporation
Bought by
Solaas Yvonne M
Current Estimated Value
Home Financials for this Owner
Home Financials are based on the most recent Mortgage that was taken out on this home.
Original Mortgage
$196,377
Outstanding Balance
$163,372
Interest Rate
5.62%
Mortgage Type
FHA
Estimated Equity
$303,927
Purchase Details
Closed on
Mar 24, 2008
Sold by
Investment Properties Of Paonia Llc
Bought by
The Streza Corp
Home Financials for this Owner
Home Financials are based on the most recent Mortgage that was taken out on this home.
Original Mortgage
$190,000
Interest Rate
6.19%
Mortgage Type
Construction
Purchase Details
Closed on
May 2, 2003
Sold by
Foothills-Paonia Llc
Bought by
Investment Properties Of Paonia Llc
Create a Home Valuation Report for This Property
The Home Valuation Report is an in-depth analysis detailing your home's value as well as a comparison with similar homes in the area
Home Values in the Area
Average Home Value in this Area
Purchase History
| Date | Buyer | Sale Price | Title Company |
|---|---|---|---|
| Solaas Yvonne M | $200,000 | Land Title Guarantee Company | |
| The Streza Corp | -- | None Available | |
| Investment Properties Of Paonia Llc | $350,000 | -- |
Source: Public Records
Mortgage History
| Date | Status | Borrower | Loan Amount |
|---|---|---|---|
| Open | Solaas Yvonne M | $17,804 | |
| Closed | Solaas Yvonne M | $8,711 | |
| Closed | Solaas Yvonne M | $13,636 | |
| Open | Solaas Yvonne M | $196,377 | |
| Previous Owner | The Streza Corporation | $190,000 |
Source: Public Records
Tax History Compared to Growth
Tax History
| Year | Tax Paid | Tax Assessment Tax Assessment Total Assessment is a certain percentage of the fair market value that is determined by local assessors to be the total taxable value of land and additions on the property. | Land | Improvement |
|---|---|---|---|---|
| 2024 | $2,187 | $33,652 | $2,334 | $31,318 |
| 2023 | $2,187 | $33,652 | $2,334 | $31,318 |
| 2022 | $1,407 | $21,996 | $1,522 | $20,474 |
| 2021 | $1,412 | $22,629 | $1,566 | $21,063 |
| 2020 | $1,232 | $19,443 | $1,566 | $17,877 |
| 2019 | $1,213 | $19,443 | $1,566 | $17,877 |
| 2018 | $1,006 | $15,350 | $1,762 | $13,588 |
| 2017 | $891 | $15,350 | $1,762 | $13,588 |
| 2016 | $950 | $17,057 | $2,564 | $14,493 |
| 2014 | -- | $19,776 | $0 | $19,776 |
Source: Public Records
Map
Nearby Homes
- TBD Hidden Mesa Ln
- 13963 Dry Gulch Rd
- 42383 Lamborn Mesa Rd
- 42321 Lamborn Mesa Rd
- 41027 Lamborn Dr
- 218 Rio Grande Ave
- 57 Cedar Dr
- 40822 Stewart Mesa Rd
- Parcel D - TBD Lamborn Mesa Rd
- Parcel B - TBD Lamborn Mesa Rd
- Parcel C - TBD Lamborn Mesa Rd
- 513 3rd St
- 100 Onarga Ave
- 210 Poplar Ave
- 112 1st St
- 40532 M75 Rd
- 12 1st St
- 127 Niagara Ave
- 337 Grand Ave
- 334 Grand Ave
- 13613 Landsend Mountain Ln Unit Lot 1, Block 1 Hidde
- 0 Landsend Mountain Ln Unit 757420
- 0 Landsend Mountain Ln Unit 753061
- 0 Landsend Mountain Ln Unit 633587
- 0 Landsend Mountain Ln Unit 634601
- 0 Landsend Mountain Ln Unit 642522
- 0 Landsend Mountain Ln Unit 661004
- 0 Landsend Mountain Ln Unit 678774
- 0 Landsend Mountain Ln Unit Lot 1, Block 1 Hidde
- 13269 Landsend Mountain Ln
- 42811 Hidden Valley Dr
- 13622 Landsend Mountain Ln
- 13629 Landsend Mountain Ln
- 13628 Landsend Mountain Ln
- 42814 Hidden Valley Dr
- 42815 Hidden Valley Dr
- 0 Hidden Valley Dr
- 13643 Lamborn Mountain Ln
- 13647 Lamborn Mountain Ln
- 0 Lamborn Mountain Dr