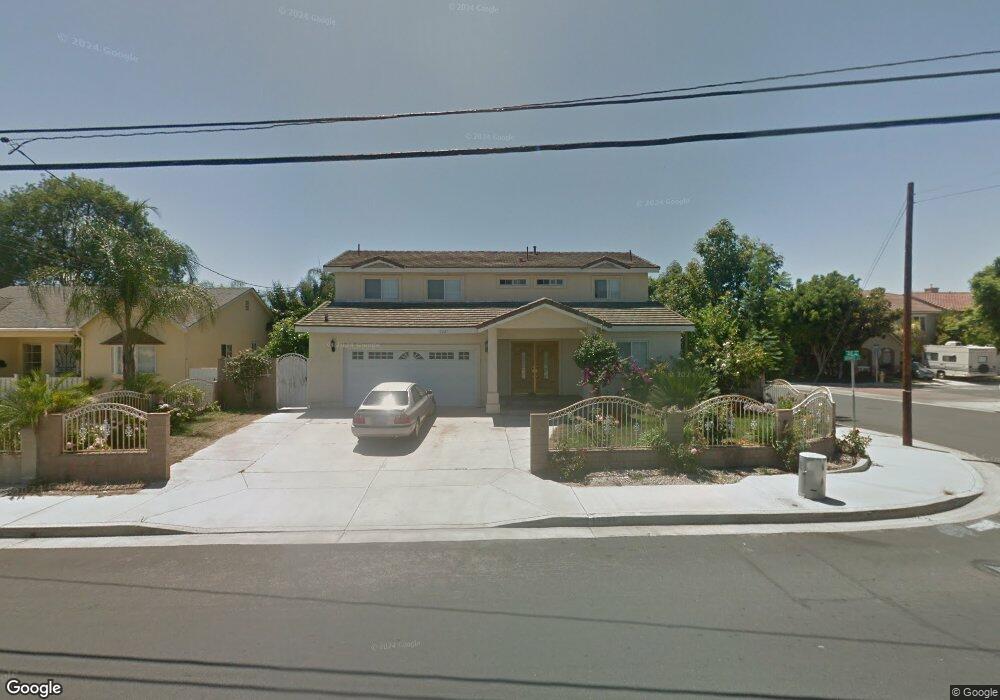
13621 Monroe St Westminster, CA 92683
Estimated Value: $895,000 - $1,521,000
2
Beds
5
Baths
2,666
Sq Ft
$485/Sq Ft
Est. Value
About This Home
This home is located at 13621 Monroe St, Westminster, CA 92683 and is currently estimated at $1,293,745, approximately $485 per square foot. 13621 Monroe St is a home located in Orange County with nearby schools including Meairs Elementary School, Warner Middle, and Westminster High School.
Ownership History
Date
Name
Owned For
Owner Type
Purchase Details
Closed on
Apr 8, 2002
Sold by
Vo Sean T
Bought by
Tonnu Joanne C
Current Estimated Value
Home Financials for this Owner
Home Financials are based on the most recent Mortgage that was taken out on this home.
Original Mortgage
$188,000
Interest Rate
6.78%
Purchase Details
Closed on
Nov 7, 2000
Sold by
Spindle Thomas M and Spindle Angela K
Bought by
Vo Sean T
Home Financials for this Owner
Home Financials are based on the most recent Mortgage that was taken out on this home.
Original Mortgage
$171,926
Interest Rate
7.82%
Mortgage Type
FHA
Purchase Details
Closed on
Jun 12, 1995
Sold by
Chappel Ronald C and Chappel Marilyn Taylor
Bought by
Spindle Thomas M and Spindle Angela K
Home Financials for this Owner
Home Financials are based on the most recent Mortgage that was taken out on this home.
Original Mortgage
$129,030
Interest Rate
7.61%
Mortgage Type
Assumption
Create a Home Valuation Report for This Property
The Home Valuation Report is an in-depth analysis detailing your home's value as well as a comparison with similar homes in the area
Home Values in the Area
Average Home Value in this Area
Purchase History
| Date | Buyer | Sale Price | Title Company |
|---|---|---|---|
| Tonnu Joanne C | $235,000 | Southland Title Corporation | |
| Vo Sean T | $175,000 | Landwood Title | |
| Spindle Thomas M | $126,500 | Investors Title Company |
Source: Public Records
Mortgage History
| Date | Status | Borrower | Loan Amount |
|---|---|---|---|
| Closed | Tonnu Joanne C | $188,000 | |
| Previous Owner | Vo Sean T | $171,926 | |
| Previous Owner | Spindle Thomas M | $129,030 |
Source: Public Records
Tax History
| Year | Tax Paid | Tax Assessment Tax Assessment Total Assessment is a certain percentage of the fair market value that is determined by local assessors to be the total taxable value of land and additions on the property. | Land | Improvement |
|---|---|---|---|---|
| 2025 | $8,270 | $702,166 | $297,034 | $405,132 |
| 2024 | $8,270 | $688,399 | $291,210 | $397,189 |
| 2023 | $7,989 | $674,901 | $285,500 | $389,401 |
| 2022 | $7,868 | $661,668 | $279,902 | $381,766 |
| 2021 | $7,678 | $648,695 | $274,414 | $374,281 |
| 2020 | $7,587 | $642,044 | $271,600 | $370,444 |
| 2019 | $7,501 | $629,455 | $266,274 | $363,181 |
| 2018 | $7,501 | $617,113 | $261,053 | $356,060 |
| 2017 | $7,215 | $605,013 | $255,934 | $349,079 |
| 2016 | $6,986 | $593,150 | $250,915 | $342,235 |
| 2015 | $6,866 | $584,241 | $247,146 | $337,095 |
| 2014 | $6,712 | $572,797 | $242,305 | $330,492 |
Source: Public Records
Map
Nearby Homes
- 8197 Jasmine Ave
- 8122 Bestel Ave
- 8561 Gloria Ave
- 13631 Richardson Way
- 13141 Monroe St
- 8520 Lake Knoll Ave Unit C
- 13182 Jason Ct
- 13523 Cobblestone Ln
- 13361 Yockey St
- 8615 Meadow Brook Ave Unit 101
- 7603 23rd St
- 8784 Hewitt Place Unit 12
- 8842 Enloe Ave
- 12892 Adelle St
- 12941 Josephine St
- 13202 Hoover St Unit 42
- 13131 Ferndale Dr
- 14352 Beach Blvd Unit 66
- 14352 Beach Blvd Unit 127
- 14352 Beach Blvd Unit 95
- 13631 Monroe St
- 8222 23rd St
- 8221 Jasmine Ave
- 8212 23rd St
- 8218 Jasmine Ave
- 8252 23rd St
- 8231 22nd St
- 8217 Jasmine Ave
- 8221 22nd St
- 13632 Monroe St
- 8216 Jasmine Ave
- 8241 23rd St
- 8201 23rd St
- 13652 Monroe St
- 8215 Jasmine Ave
- 8188 23rd St
- 8214 Jasmine Ave
- 8191 Jasmine Ave
- 8193 22nd St
- 13591 Jefferson St
Your Personal Tour Guide
Ask me questions while you tour the home.