Estimated Value: $544,000 - $657,893
3
Beds
2
Baths
1,306
Sq Ft
$459/Sq Ft
Est. Value
About This Home
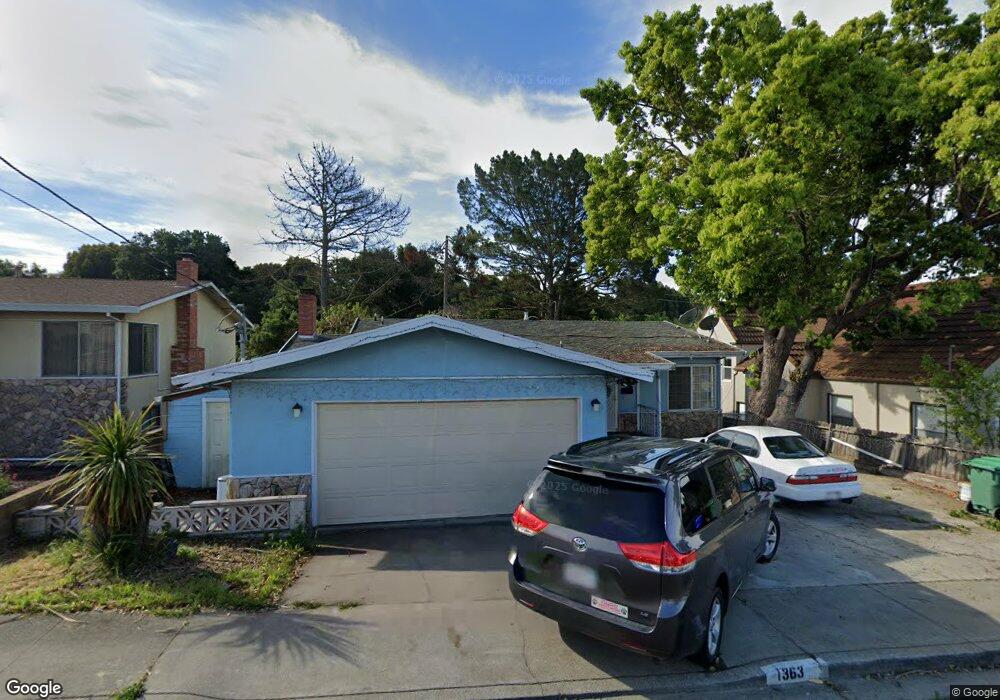
This home is located at 1363 7th St, Rodeo, CA 94572 and is currently estimated at $599,973, approximately $459 per square foot. 1363 7th St is a home located in Contra Costa County with nearby schools including Rodeo Hills Elementary School, Carquinez Middle School, and John Swett High School.
Ownership History
Date
Name
Owned For
Owner Type
Purchase Details
Closed on
Sep 22, 2008
Sold by
Oppus Freny V
Bought by
Oppus Freny and Oppus Arthur C
Current Estimated Value
Purchase Details
Closed on
Dec 28, 2005
Sold by
Oppus Arthur
Bought by
Oppus Freny
Home Financials for this Owner
Home Financials are based on the most recent Mortgage that was taken out on this home.
Original Mortgage
$375,000
Outstanding Balance
$144,134
Interest Rate
1.5%
Mortgage Type
Fannie Mae Freddie Mac
Estimated Equity
$455,839
Purchase Details
Closed on
Dec 18, 2003
Sold by
Villegas Felix and Villegas Maria Fe
Bought by
Villegas Felix and Villegas Maria Fe
Home Financials for this Owner
Home Financials are based on the most recent Mortgage that was taken out on this home.
Original Mortgage
$257,600
Interest Rate
7.25%
Mortgage Type
Stand Alone Refi Refinance Of Original Loan
Purchase Details
Closed on
Dec 15, 2003
Sold by
Villegas Felix and Villegas Freny S
Bought by
Villegas Felix and Villegas Maria Fe
Home Financials for this Owner
Home Financials are based on the most recent Mortgage that was taken out on this home.
Original Mortgage
$257,600
Interest Rate
7.25%
Mortgage Type
Stand Alone Refi Refinance Of Original Loan
Purchase Details
Closed on
Sep 11, 2000
Sold by
Villegas Maria Fe
Bought by
Villegas Froilan and Villegas Felix
Home Financials for this Owner
Home Financials are based on the most recent Mortgage that was taken out on this home.
Original Mortgage
$243,750
Interest Rate
8.11%
Mortgage Type
Stand Alone First
Purchase Details
Closed on
Jul 27, 1998
Sold by
Federal National Mortgage Association
Bought by
Villegas Froilan and Fillegas Maria Fe
Home Financials for this Owner
Home Financials are based on the most recent Mortgage that was taken out on this home.
Original Mortgage
$132,000
Interest Rate
6.9%
Mortgage Type
Stand Alone First
Purchase Details
Closed on
Mar 25, 1998
Sold by
Gormley Christopher J and Gormley Susan
Bought by
Federal National Mortgage Association
Create a Home Valuation Report for This Property
The Home Valuation Report is an in-depth analysis detailing your home's value as well as a comparison with similar homes in the area
Home Values in the Area
Average Home Value in this Area
Purchase History
| Date | Buyer | Sale Price | Title Company |
|---|---|---|---|
| Oppus Freny | -- | None Available | |
| Oppus Freny | -- | Commonwealth Title | |
| Oppus Freny | $250,000 | Commonwealth Title | |
| Villegas Felix | -- | North American Title | |
| Villegas Felix | -- | North American Title Co | |
| Villegas Froilan | -- | Chicago Title Co | |
| Villegas Froilan | $165,000 | Chicago Title Co | |
| Federal National Mortgage Association | $148,000 | First American Title |
Source: Public Records
Mortgage History
| Date | Status | Borrower | Loan Amount |
|---|---|---|---|
| Open | Oppus Freny | $375,000 | |
| Previous Owner | Villegas Felix | $257,600 | |
| Previous Owner | Villegas Froilan | $243,750 | |
| Previous Owner | Villegas Froilan | $132,000 | |
| Closed | Villegas Froilan | $16,500 |
Source: Public Records
Tax History
| Year | Tax Paid | Tax Assessment Tax Assessment Total Assessment is a certain percentage of the fair market value that is determined by local assessors to be the total taxable value of land and additions on the property. | Land | Improvement |
|---|---|---|---|---|
| 2025 | $8,333 | $586,000 | $439,503 | $146,497 |
| 2024 | $8,367 | $586,000 | $439,503 | $146,497 |
| 2023 | $8,367 | $586,000 | $440,000 | $146,000 |
| 2022 | $8,844 | $626,000 | $469,503 | $156,497 |
| 2021 | $7,631 | $525,500 | $394,127 | $131,373 |
| 2019 | $6,296 | $413,000 | $309,752 | $103,248 |
| 2018 | $5,752 | $373,000 | $279,751 | $93,249 |
| 2017 | $5,224 | $329,500 | $247,126 | $82,374 |
| 2016 | $4,397 | $286,000 | $214,501 | $71,499 |
| 2015 | $4,174 | $265,000 | $198,751 | $66,249 |
| 2014 | $3,500 | $205,500 | $154,125 | $51,375 |
Source: Public Records
Map
Nearby Homes
Your Personal Tour Guide
Ask me questions while you tour the home.