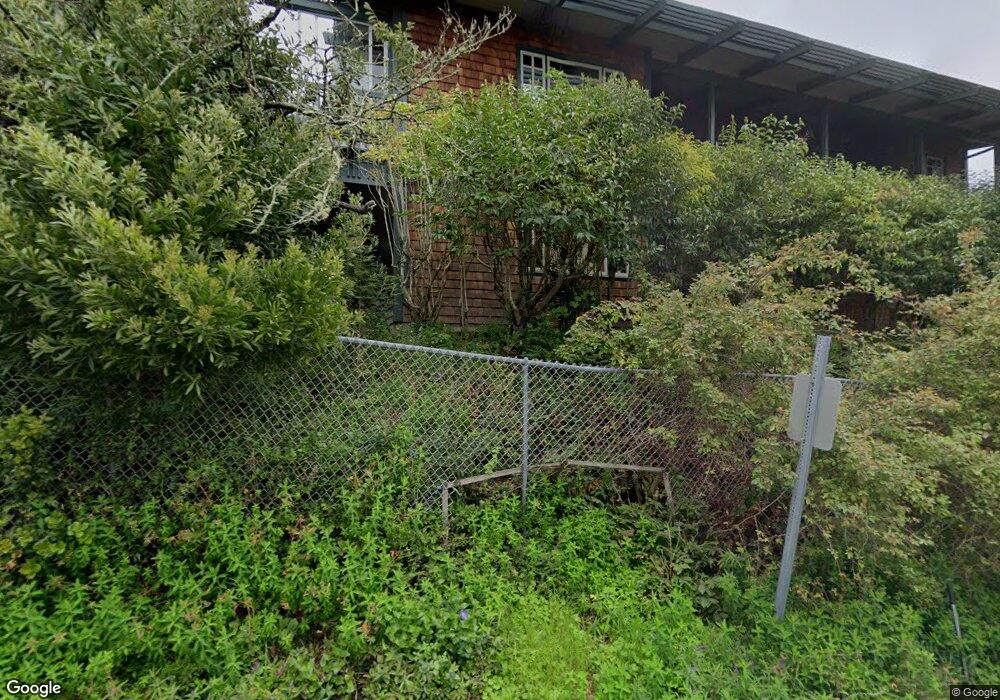
1363 Summit Rd Berkeley, CA 94708
Berkeley Hills NeighborhoodEstimated Value: $2,001,000 - $2,519,000
4
Beds
3
Baths
3,300
Sq Ft
$653/Sq Ft
Est. Value
About This Home
This home is located at 1363 Summit Rd, Berkeley, CA 94708 and is currently estimated at $2,156,396, approximately $653 per square foot. 1363 Summit Rd is a home located in Alameda County with nearby schools including Cragmont Elementary School, Berkeley Arts Magnet at Whittier School, and Washington Elementary School.
Ownership History
Date
Name
Owned For
Owner Type
Purchase Details
Closed on
May 20, 2015
Sold by
Vonder Hude Charlotte
Bought by
Vonder Hude Anne Charlotte and Anne Charlotte Von Der Hude Tr
Current Estimated Value
Purchase Details
Closed on
Jul 17, 2003
Sold by
Gal Yoav and Gal Robin
Bought by
Gal Yoav and Gal Robin
Home Financials for this Owner
Home Financials are based on the most recent Mortgage that was taken out on this home.
Original Mortgage
$322,700
Interest Rate
5.15%
Mortgage Type
Purchase Money Mortgage
Purchase Details
Closed on
Feb 24, 2003
Sold by
Gal Yoav and Gal Robin
Bought by
Gal Yoav and Gal Robin
Home Financials for this Owner
Home Financials are based on the most recent Mortgage that was taken out on this home.
Original Mortgage
$322,700
Interest Rate
5.85%
Create a Home Valuation Report for This Property
The Home Valuation Report is an in-depth analysis detailing your home's value as well as a comparison with similar homes in the area
Home Values in the Area
Average Home Value in this Area
Purchase History
| Date | Buyer | Sale Price | Title Company |
|---|---|---|---|
| Vonder Hude Anne Charlotte | -- | None Available | |
| Gal Yoav | -- | Fidelity National Title Co | |
| Gal Yoav | -- | Fidelity National Title Co | |
| Gal Yoav | -- | Fidelity National Title Co | |
| Gal Yoav | -- | -- |
Source: Public Records
Mortgage History
| Date | Status | Borrower | Loan Amount |
|---|---|---|---|
| Closed | Gal Yoav | $322,700 | |
| Closed | Gal Yoav | $322,700 |
Source: Public Records
Tax History
| Year | Tax Paid | Tax Assessment Tax Assessment Total Assessment is a certain percentage of the fair market value that is determined by local assessors to be the total taxable value of land and additions on the property. | Land | Improvement |
|---|---|---|---|---|
| 2025 | $22,985 | $1,289,675 | $378,764 | $917,911 |
| 2024 | $22,985 | $1,264,253 | $371,338 | $899,915 |
| 2023 | $22,411 | $1,246,329 | $364,058 | $882,271 |
| 2022 | $21,875 | $1,214,893 | $356,920 | $864,973 |
| 2021 | $21,885 | $1,190,939 | $349,923 | $848,016 |
| 2020 | $20,568 | $1,185,659 | $346,336 | $839,323 |
| 2019 | $19,599 | $1,162,416 | $339,546 | $822,870 |
| 2018 | $19,215 | $1,139,626 | $332,889 | $806,737 |
| 2017 | $18,560 | $1,117,282 | $326,363 | $790,919 |
| 2016 | $17,853 | $1,095,377 | $319,964 | $775,413 |
| 2015 | $17,584 | $1,078,928 | $315,159 | $763,769 |
| 2014 | $17,177 | $1,057,798 | $308,987 | $748,811 |
Source: Public Records
Map
Nearby Homes
- 230 Fairlawn Dr
- 1375 Queens Rd
- 1221 Grizzly Peak Blvd
- 1160 Miller Ave
- 20 Stevenson Ave
- 2893 Buena Vista Way
- 1179 Keith Ave
- 1155 Keeler Ave
- 2686 Shasta Rd
- 1110 Sterling Ave
- 1165 Cragmont Ave
- 1119 Miller Ave
- 1100 Miller Ave
- 1040 Park Hills Rd
- 1698 La Loma Ave Unit 1698
- 2501 Rose Walk
- 2700 Le Conte Ave Unit 301
- 2700 Le Conte Ave Unit 402
- 2600 Hilgard Ave
- 1106 Cragmont Ave
- 1365 Summit Rd
- 1330 Summit Rd
- 1375 Summit Rd
- 1366 Summit Rd
- 1360 Summit Rd
- 1372 Summit Rd
- 1352 Summit Rd
- 1385 Summit Rd
- 1380 Summit Rd
- 1350 Summit Rd
- 1384 Summit Rd
- 1395 Grizzly Peak Blvd
- 1389 Grizzly Peak Blvd
- 1401 Grizzly Peak Blvd
- 1385 Grizzly Peak Blvd
- 1407 Grizzly Peak Blvd
- 1411 Grizzly Peak Blvd
- 1379 Grizzly Peak Blvd
- 1415 Grizzly Peak Blvd
- 1375 Grizzly Peak Blvd
Your Personal Tour Guide
Ask me questions while you tour the home.