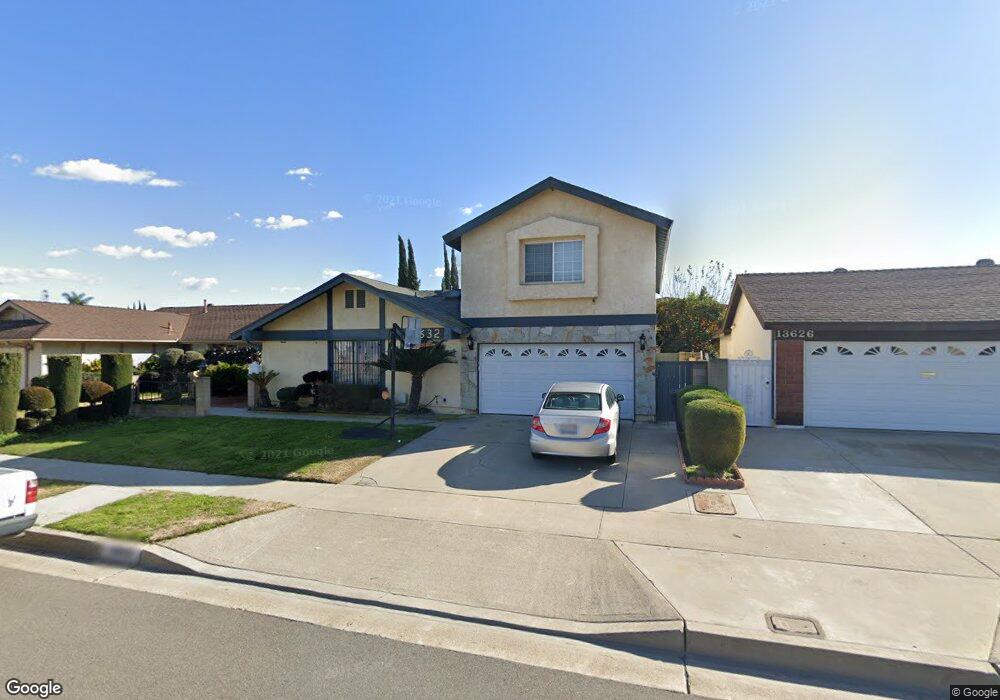
13632 Carnaby St Cerritos, CA 90703
Estimated Value: $1,254,206 - $1,565,000
3
Beds
3
Baths
2,656
Sq Ft
$510/Sq Ft
Est. Value
About This Home
This home is located at 13632 Carnaby St, Cerritos, CA 90703 and is currently estimated at $1,354,052, approximately $509 per square foot. 13632 Carnaby St is a home located in Los Angeles County with nearby schools including Cerritos Elementary School, Carmenita Middle School, and Cerritos High School.
Ownership History
Date
Name
Owned For
Owner Type
Purchase Details
Closed on
Mar 21, 2002
Sold by
Ly Jamie V
Bought by
Depew Bradley B and Ly Jamie
Current Estimated Value
Purchase Details
Closed on
Jan 3, 2002
Sold by
Ly Linda Tuyet Tran
Bought by
Ly Jamie and Depew Bradley B
Purchase Details
Closed on
Dec 11, 1998
Sold by
Ly Linda T
Bought by
Ly Linda Tuyettran and Ly Jamie
Home Financials for this Owner
Home Financials are based on the most recent Mortgage that was taken out on this home.
Original Mortgage
$162,000
Outstanding Balance
$37,211
Interest Rate
6.91%
Estimated Equity
$1,316,841
Purchase Details
Closed on
Oct 29, 1993
Sold by
Yang Louis L
Bought by
Ly Linda Tuyetvan
Home Financials for this Owner
Home Financials are based on the most recent Mortgage that was taken out on this home.
Original Mortgage
$162,000
Interest Rate
6.95%
Create a Home Valuation Report for This Property
The Home Valuation Report is an in-depth analysis detailing your home's value as well as a comparison with similar homes in the area
Home Values in the Area
Average Home Value in this Area
Purchase History
| Date | Buyer | Sale Price | Title Company |
|---|---|---|---|
| Depew Bradley B | -- | Fidelity National Title | |
| Ly Jamie | -- | -- | |
| Ly Linda Tuyettran | -- | First American Title Co | |
| Ly Linda Tuyetvan | $180,000 | Gateway Title Company |
Source: Public Records
Mortgage History
| Date | Status | Borrower | Loan Amount |
|---|---|---|---|
| Open | Ly Linda Tuyettran | $162,000 | |
| Closed | Ly Linda Tuyetvan | $162,000 |
Source: Public Records
Tax History
| Year | Tax Paid | Tax Assessment Tax Assessment Total Assessment is a certain percentage of the fair market value that is determined by local assessors to be the total taxable value of land and additions on the property. | Land | Improvement |
|---|---|---|---|---|
| 2025 | $7,286 | $606,317 | $265,903 | $340,414 |
| 2024 | $7,286 | $594,430 | $260,690 | $333,740 |
| 2023 | $7,049 | $582,776 | $255,579 | $327,197 |
| 2022 | $6,941 | $571,350 | $250,568 | $320,782 |
| 2021 | $6,771 | $560,148 | $245,655 | $314,493 |
| 2019 | $6,614 | $543,536 | $238,370 | $305,166 |
| 2018 | $6,120 | $532,880 | $233,697 | $299,183 |
| 2016 | $5,862 | $512,189 | $224,623 | $287,566 |
| 2015 | $5,788 | $504,496 | $221,249 | $283,247 |
| 2014 | $5,672 | $494,615 | $216,916 | $277,699 |
Source: Public Records
Map
Nearby Homes
- 13506 Darvalle St
- 17405 Jasmine Way
- 18727 Holmes Ave
- 13626 Aclare Ln
- 17105 Holmes Cir
- 13202 Carolyn St
- 13044 Hedda Ln
- 5161 Dumaine Dr
- 5271 Niguel Dr
- 5865 Brazil Dr
- 13010 Artesia Blvd
- 5826 Bolivia Dr
- 19008 Jeffrey Ave
- 13011 Hart Place
- 13728 Carleton Dr
- 5568 Ozawa Cir
- 5836 Trinidad Way
- 7582 Silverado Ln
- 7425 Bradley Dr
- 16412 Stowers Ave
- 13638 Carnaby St
- 13626 Carnaby St
- 13702 Carnaby St
- 13622 Carnaby St
- 18020 Laurelbrook Place
- 13708 Carnaby St
- 13616 Carnaby St
- 18021 Laurelbrook Place
- 18014 Laurelbrook Place
- 13610 Carnaby St
- 13712 Carnaby St
- 18015 Laurelbrook Place
- 18015 Gerritt Place
- 18020 Newbrook Ave
- 18006 Laurelbrook Place
- 18007 Laurelbrook Place
- 13718 Carnaby St
- 18007 Gerritt Place
- 18014 Newbrook Ave
- 13606 Carnaby St
Your Personal Tour Guide
Ask me questions while you tour the home.