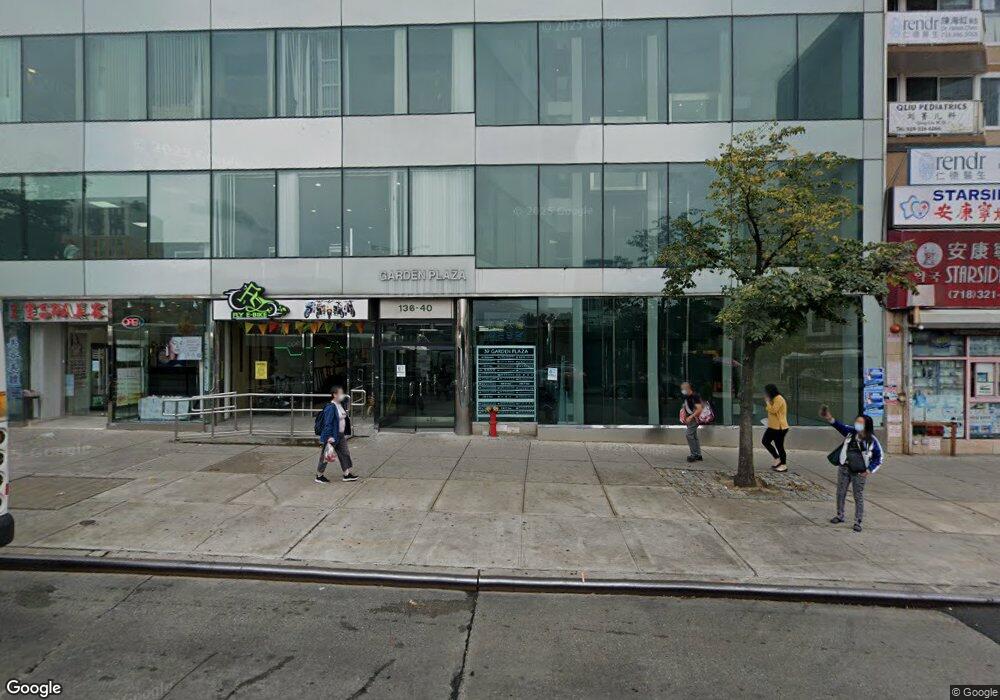
13640 39th Ave Unit GA Flushing, NY 11354
Flushing Neighborhood
--
Bed
--
Bath
1,981
Sq Ft
5,706
Sq Ft Lot
About This Home
This home is located at 13640 39th Ave Unit GA, Flushing, NY 11354. 13640 39th Ave Unit GA is a home located in Queens County with nearby schools including P.S. 209 - Clearview Gardens, I.S. 25 Adrien Block, and Flushing High School.
Ownership History
Date
Name
Owned For
Owner Type
Purchase Details
Closed on
Jan 11, 2013
Sold by
Unit 6A Flushing Llc
Bought by
39Th Avenue Unit 6A Llc
Purchase Details
Closed on
Aug 10, 2004
Sold by
Advanced Associates Inc and Wilson Ko %
Bought by
Unit 6A Flushing Llc
Purchase Details
Closed on
Jan 16, 2001
Sold by
Korea Shuttle Express Corp
Bought by
Advanced Associates Inc
Home Financials for this Owner
Home Financials are based on the most recent Mortgage that was taken out on this home.
Original Mortgage
$450,000
Interest Rate
7.08%
Mortgage Type
Commercial
Purchase Details
Closed on
Mar 23, 1995
Sold by
Huang Alice and Huang Thomas
Bought by
Wang Chung Management Inc
Create a Home Valuation Report for This Property
The Home Valuation Report is an in-depth analysis detailing your home's value as well as a comparison with similar homes in the area
Home Values in the Area
Average Home Value in this Area
Purchase History
| Date | Buyer | Sale Price | Title Company |
|---|---|---|---|
| 39Th Avenue Unit 6A Llc | -- | -- | |
| 39Th Avenue Unit 6A Llc | -- | -- | |
| Unit 6A Flushing Llc | -- | -- | |
| Unit 6A Flushing Llc | -- | -- | |
| Advanced Associates Inc | $650,000 | -- | |
| Advanced Associates Inc | $650,000 | -- | |
| Wang Chung Management Inc | -- | -- | |
| Wang Chung Management Inc | -- | -- |
Source: Public Records
Mortgage History
| Date | Status | Borrower | Loan Amount |
|---|---|---|---|
| Previous Owner | Advanced Associates Inc | $450,000 |
Source: Public Records
Tax History Compared to Growth
Tax History
| Year | Tax Paid | Tax Assessment Tax Assessment Total Assessment is a certain percentage of the fair market value that is determined by local assessors to be the total taxable value of land and additions on the property. | Land | Improvement |
|---|---|---|---|---|
| 2025 | $36,479 | $348,864 | $44,112 | $304,752 |
| 2024 | $36,479 | $344,400 | $44,112 | $300,288 |
| 2023 | $36,466 | $344,277 | $44,112 | $300,165 |
| 2022 | $36,634 | $344,985 | $44,112 | $300,873 |
| 2021 | $29,085 | $271,979 | $44,112 | $227,867 |
| 2020 | $33,853 | $349,344 | $44,112 | $305,232 |
| 2019 | $32,266 | $341,522 | $44,112 | $297,410 |
| 2018 | $30,998 | $294,824 | $44,111 | $250,713 |
| 2017 | $30,095 | $286,240 | $44,112 | $242,128 |
| 2016 | $28,536 | $286,240 | $44,112 | $242,128 |
| 2015 | $13,771 | $250,660 | $42,564 | $208,096 |
| 2014 | $13,771 | $230,699 | $41,792 | $188,907 |
Source: Public Records
Map
Nearby Homes
- 13835 39th Ave Unit 17M
- 142-05 Roosevelt Ave Unit 517
- 142-05 Roosevelt Ave Unit 439
- 142-05 Roosevelt Ave Unit 310
- 142-05 Roosevelt Ave Unit 204
- 142-05 Roosevelt Ave Unit 721
- 142-05 Roosevelt Ave Unit 415
- 142-05 Roosevelt Ave Unit 328
- 142-05 Roosevelt Ave Unit 627
- 142-05 Roosevelt Ave Unit 602
- 142-05 Roosevelt Ave Unit 405
- 142-05 Roosevelt Ave Unit 301
- 142-05 Roosevelt Ave Unit 521
- 136-46 41st Ave Unit 6A
- 136-46 41st Ave Unit 2A
- 136-75 37th Ave Unit PH B
- 136-75 37th Ave Unit 10H
- 136-80 41st Ave Unit 7H
- 136-80 41st Ave Unit 5H
- 41-25 Kissena Blvd Unit 3 F
- 13640 39th Ave Unit D3
- 13640 39th Ave
- 13640 39th Ave Unit 204
- 13640 39th Ave Unit 1B
- 13640 39th Ave Unit 6A Rm5
- 13640 39th Ave Unit 6A Mez
- 13640 39th Ave Unit 6A Rm4
- 13640 39th Ave Unit 6A Rm3
- 13640 39th Ave Unit 6A Rm2
- 13640 39th Ave Unit 6A Rm1
- 13640 39th Ave Unit 6A
- 13640 39th Ave Unit B-2
- 13640 39th Ave Unit 602
- 13640 39th Ave Unit 302
- 13640 39th Ave Unit 507
- 13640 39th Ave Unit 303&4
- 13640 39th Ave
- 13640 39th Ave Unit 1
- 13640 39th Ave Unit 6th Fl
- 13640 39th Ave Unit 302