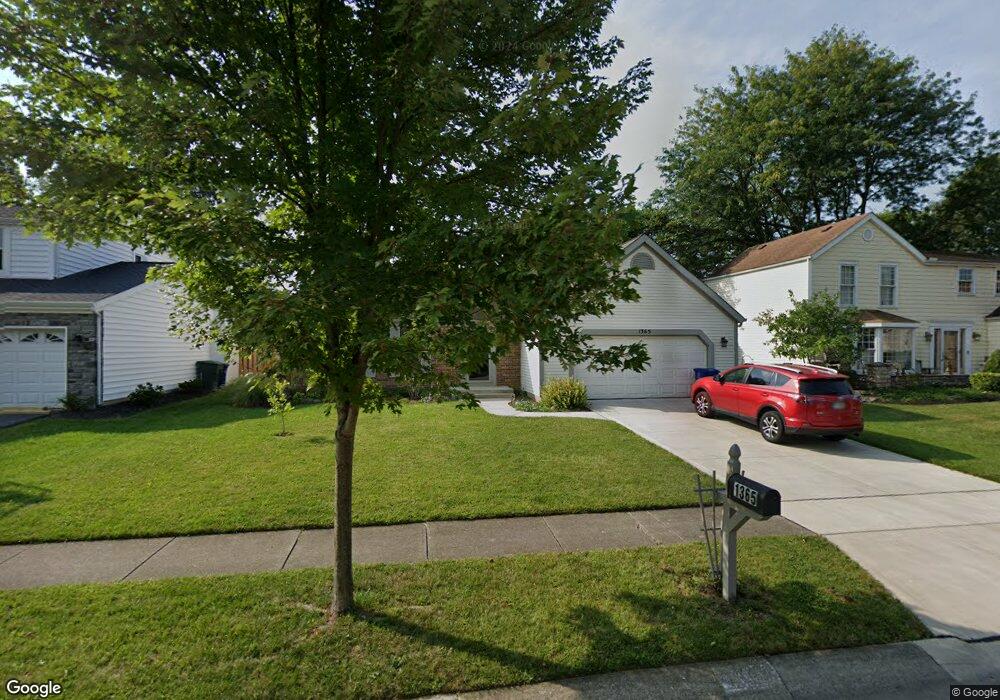
1365 Tiehack Ct Columbus, OH 43235
Worthingview NeighborhoodEstimated Value: $358,936 - $434,000
3
Beds
2
Baths
1,434
Sq Ft
$282/Sq Ft
Est. Value
About This Home
This home is located at 1365 Tiehack Ct, Columbus, OH 43235 and is currently estimated at $404,734, approximately $282 per square foot. 1365 Tiehack Ct is a home located in Franklin County with nearby schools including Bluffsview Elementary School, McCord Middle School, and Worthington Kilbourne High School.
Ownership History
Date
Name
Owned For
Owner Type
Purchase Details
Closed on
Dec 31, 2012
Sold by
Rein Scott R and Rein Carol A
Bought by
Rein Carol A
Current Estimated Value
Home Financials for this Owner
Home Financials are based on the most recent Mortgage that was taken out on this home.
Original Mortgage
$85,000
Outstanding Balance
$58,062
Interest Rate
3.3%
Mortgage Type
New Conventional
Estimated Equity
$346,672
Purchase Details
Closed on
Feb 29, 2000
Sold by
Rein Scott R and Rein Carol A
Bought by
Rein Scott R and Rein Carol A
Purchase Details
Closed on
May 3, 1995
Sold by
Macdonald Jan A
Bought by
Rein Scott R and Rein Carol A
Home Financials for this Owner
Home Financials are based on the most recent Mortgage that was taken out on this home.
Original Mortgage
$116,800
Interest Rate
8.43%
Mortgage Type
New Conventional
Purchase Details
Closed on
Jan 21, 1992
Purchase Details
Closed on
Nov 27, 1989
Create a Home Valuation Report for This Property
The Home Valuation Report is an in-depth analysis detailing your home's value as well as a comparison with similar homes in the area
Home Values in the Area
Average Home Value in this Area
Purchase History
| Date | Buyer | Sale Price | Title Company |
|---|---|---|---|
| Rein Carol A | -- | None Available | |
| Rein Scott R | -- | -- | |
| Rein Scott R | $123,000 | -- | |
| -- | $55,500 | -- | |
| -- | $104,000 | -- |
Source: Public Records
Mortgage History
| Date | Status | Borrower | Loan Amount |
|---|---|---|---|
| Open | Rein Carol A | $85,000 | |
| Previous Owner | Rein Scott R | $116,800 |
Source: Public Records
Tax History
| Year | Tax Paid | Tax Assessment Tax Assessment Total Assessment is a certain percentage of the fair market value that is determined by local assessors to be the total taxable value of land and additions on the property. | Land | Improvement |
|---|---|---|---|---|
| 2025 | $6,585 | $107,250 | $37,700 | $69,550 |
| 2024 | $6,585 | $107,250 | $37,700 | $69,550 |
| 2023 | $6,297 | $107,240 | $37,695 | $69,545 |
| 2022 | $4,947 | $66,860 | $19,080 | $47,780 |
| 2021 | $4,564 | $66,860 | $19,080 | $47,780 |
| 2020 | $4,396 | $66,860 | $19,080 | $47,780 |
| 2019 | $4,211 | $57,790 | $16,590 | $41,200 |
| 2018 | $4,257 | $57,790 | $16,590 | $41,200 |
| 2017 | $4,104 | $57,790 | $16,590 | $41,200 |
| 2016 | $4,434 | $62,450 | $16,770 | $45,680 |
| 2015 | $4,435 | $62,450 | $16,770 | $45,680 |
| 2014 | $4,433 | $62,450 | $16,770 | $45,680 |
| 2013 | $2,004 | $56,735 | $15,225 | $41,510 |
Source: Public Records
Map
Nearby Homes
- 1380 Tiehack Ct
- 1278 Amol Ln
- 7164 Durness Place
- 7370 Coldstream Dr
- 1327 Donahey St
- 6904 Clydeway Ct
- 6623 Millbrae Rd
- 1930 Shallowford Ave
- 6747 Merwin Rd
- 6637 Merwin Rd
- 7034 Rockhaven Place
- 6876 Spruce Pine Dr
- 1978 Shallowford Ave
- 6784 Heathview St
- 2001 Sawbury Blvd Unit 2001
- 7746 Sagemeadow Ct
- 1001 Rutherglen Dr
- 797 Troon Trail
- 2074 Hard Rd
- 1986 Sutter Pkwy
- 1357 Tiehack Ct
- 1373 Tiehack Ct
- 1412 Linbrook Ct
- 1381 Tiehack Ct
- 1345 Tiehack Ct
- 1424 Linbrook Ct
- 1364 Tiehack Ct
- 1400 Linbrook Ct
- 1356 Tiehack Ct
- 1372 Tiehack Ct
- 1436 Linbrook Ct
- 1389 Tiehack Ct
- 1348 Tiehack Ct
- 1403 Tiehack Ct
- 1388 Tiehack Ct
- 7011 Linbrook Blvd
- 1448 Linbrook Ct
- 0 0 Unit 223005787
- 1369 Snowmass Rd
- 1359 Snowmass Rd
Your Personal Tour Guide
Ask me questions while you tour the home.