Estimated Value: $774,410 - $826,000
3
Beds
2
Baths
1,893
Sq Ft
$423/Sq Ft
Est. Value
About This Home
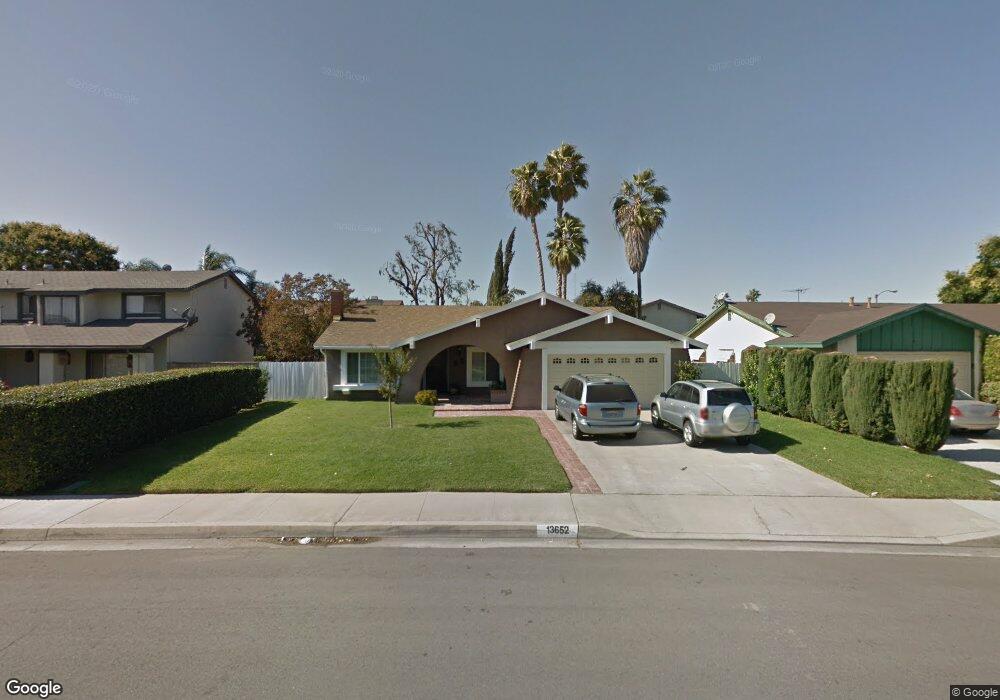
This home is located at 13652 Preciado Ave, Chino, CA 91710 and is currently estimated at $800,103, approximately $422 per square foot. 13652 Preciado Ave is a home located in San Bernardino County with nearby schools including Dickson Elementary, Ramona Junior High School, and Don Antonio Lugo High School.
Ownership History
Date
Name
Owned For
Owner Type
Purchase Details
Closed on
Sep 4, 2008
Sold by
Citibank Na
Bought by
Wang Wihsi and Wang Lifeng
Current Estimated Value
Purchase Details
Closed on
Mar 28, 2008
Sold by
Station Tracie R
Bought by
Citibank Na and Cwabs Inc Asset Backed Certificates Seri
Purchase Details
Closed on
Apr 24, 2007
Sold by
Staton Tracie R
Bought by
Staton Tracie R
Home Financials for this Owner
Home Financials are based on the most recent Mortgage that was taken out on this home.
Original Mortgage
$341,250
Interest Rate
10.65%
Mortgage Type
New Conventional
Purchase Details
Closed on
Feb 12, 2007
Sold by
Staton Tracie R
Bought by
Staton Tracie R
Home Financials for this Owner
Home Financials are based on the most recent Mortgage that was taken out on this home.
Original Mortgage
$13,100
Interest Rate
10%
Mortgage Type
New Conventional
Create a Home Valuation Report for This Property
The Home Valuation Report is an in-depth analysis detailing your home's value as well as a comparison with similar homes in the area
Home Values in the Area
Average Home Value in this Area
Purchase History
| Date | Buyer | Sale Price | Title Company |
|---|---|---|---|
| Wang Wihsi | $330,000 | Landsafe Title | |
| Citibank Na | $344,250 | Landsafe | |
| Staton Tracie R | -- | Southland Title Company | |
| Staton Tracie R | -- | None Available |
Source: Public Records
Mortgage History
| Date | Status | Borrower | Loan Amount |
|---|---|---|---|
| Previous Owner | Staton Tracie R | $341,250 | |
| Previous Owner | Staton Tracie R | $13,100 |
Source: Public Records
Tax History
| Year | Tax Paid | Tax Assessment Tax Assessment Total Assessment is a certain percentage of the fair market value that is determined by local assessors to be the total taxable value of land and additions on the property. | Land | Improvement |
|---|---|---|---|---|
| 2025 | $4,666 | $424,963 | $160,971 | $263,992 |
| 2024 | $4,541 | $416,631 | $157,815 | $258,816 |
| 2023 | $4,414 | $408,462 | $154,721 | $253,741 |
| 2022 | $4,386 | $400,453 | $151,687 | $248,766 |
| 2021 | $4,299 | $392,601 | $148,713 | $243,888 |
| 2020 | $4,243 | $388,575 | $147,188 | $241,387 |
| 2019 | $4,167 | $380,956 | $144,302 | $236,654 |
| 2018 | $4,074 | $373,487 | $141,473 | $232,014 |
| 2017 | $4,000 | $366,164 | $138,699 | $227,465 |
| 2016 | $3,736 | $358,984 | $135,979 | $223,005 |
| 2015 | $3,661 | $353,591 | $133,936 | $219,655 |
| 2014 | $3,587 | $346,664 | $131,312 | $215,352 |
Source: Public Records
Map
Nearby Homes
- 4115 Bernardo Ct
- 4182 Denali Ln
- 0 Norton Ave
- 13144 Pipeline Ave
- 4621 Chino Ave
- 3927 Christina Rd
- 13148 Derby Ave
- 13140 Derby Ave
- 3508 Spur Ct
- 4912 G St
- 13065 San Clemente Ln
- 13257 2nd St
- 13239 2nd St
- 13650 3rd St
- 13079 Monte Vista Ave
- 13123 2nd St
- 3260 Olympic View Dr
- 3248 Giant Forest Loop
- 3917 Yellowstone Cir
- 12608 Ramona Ave
- 13664 Preciado Ave
- 13640 Preciado Ave
- 4195 San Onofre Ct
- 13676 Preciado Ave
- 13653 Preciado Ave
- 4177 San Onofre Ct
- 13665 Preciado Ave
- 13643 Preciado Ave
- 13677 Preciado Ave
- 13688 Preciado Ave
- 4214 San Onofre Ct
- 4165 San Onofre Ct
- 4204 San Onofre Ct
- 4194 San Onofre Ct
- 13654 San Juan Ct
- 13689 Preciado Ave
- 4176 San Onofre Ct
- 13666 San Juan Ct
- 13620 Preciado Ave
- 13642 San Juan Ct
Your Personal Tour Guide
Ask me questions while you tour the home.