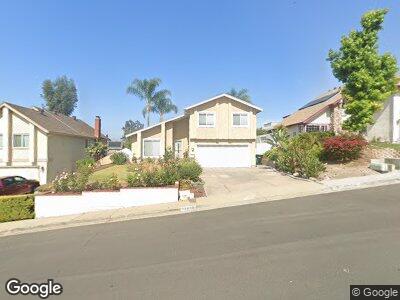
13680 Via Cima Bella San Diego, CA 92129
Rancho Peñasquitos NeighborhoodEstimated Value: $1,205,000 - $1,444,303
3
Beds
3
Baths
1,932
Sq Ft
$697/Sq Ft
Est. Value
About This Home
This home is located at 13680 Via Cima Bella, San Diego, CA 92129 and is currently estimated at $1,347,326, approximately $697 per square foot. 13680 Via Cima Bella is a home located in San Diego County with nearby schools including Sunset Hills Elementary School, Black Mountain Middle School, and Mt. Carmel High School.
Ownership History
Date
Name
Owned For
Owner Type
Purchase Details
Closed on
Jul 30, 2013
Sold by
Clum William F
Bought by
Clum William F
Current Estimated Value
Purchase Details
Closed on
Oct 20, 2005
Sold by
Kenyon Scott L and Kenyon Nanette M
Bought by
Clum William F
Home Financials for this Owner
Home Financials are based on the most recent Mortgage that was taken out on this home.
Original Mortgage
$508,000
Outstanding Balance
$277,229
Interest Rate
5.5%
Mortgage Type
Purchase Money Mortgage
Estimated Equity
$1,048,721
Purchase Details
Closed on
Jan 17, 2000
Sold by
Scott Kenyon
Bought by
Kenyon Scott L and Kenyon Nanette M
Purchase Details
Closed on
Nov 24, 1993
Sold by
Household Finance Corp
Bought by
Kenyon Scott and Kenyon Nanette
Home Financials for this Owner
Home Financials are based on the most recent Mortgage that was taken out on this home.
Original Mortgage
$148,000
Interest Rate
4.5%
Purchase Details
Closed on
May 18, 1984
Create a Home Valuation Report for This Property
The Home Valuation Report is an in-depth analysis detailing your home's value as well as a comparison with similar homes in the area
Home Values in the Area
Average Home Value in this Area
Purchase History
| Date | Buyer | Sale Price | Title Company |
|---|---|---|---|
| Clum William F | -- | None Available | |
| Clum William F | $635,000 | First American Title | |
| Kenyon Scott L | -- | -- | |
| Kenyon Scott | $185,000 | Fidelity National Title | |
| -- | $144,000 | -- |
Source: Public Records
Mortgage History
| Date | Status | Borrower | Loan Amount |
|---|---|---|---|
| Open | Clum William F | $508,000 | |
| Previous Owner | Kenyon Scott L | $137,000 | |
| Previous Owner | Kenyon Scott L | $139,000 | |
| Previous Owner | Kenyon Scott | $148,000 |
Source: Public Records
Tax History Compared to Growth
Tax History
| Year | Tax Paid | Tax Assessment Tax Assessment Total Assessment is a certain percentage of the fair market value that is determined by local assessors to be the total taxable value of land and additions on the property. | Land | Improvement |
|---|---|---|---|---|
| 2024 | $11,040 | $850,700 | $415,303 | $435,397 |
| 2023 | $10,835 | $834,020 | $407,160 | $426,860 |
| 2022 | $10,676 | $817,668 | $399,177 | $418,491 |
| 2021 | $10,554 | $801,636 | $391,350 | $410,286 |
| 2020 | $9,668 | $730,000 | $361,000 | $369,000 |
| 2019 | $9,276 | $700,000 | $347,000 | $353,000 |
| 2018 | $9,202 | $700,000 | $347,000 | $353,000 |
| 2017 | $83 | $650,000 | $323,000 | $327,000 |
| 2016 | $7,957 | $595,000 | $296,000 | $299,000 |
| 2015 | $7,967 | $595,000 | $296,000 | $299,000 |
| 2014 | $6,186 | $565,000 | $282,000 | $283,000 |
Source: Public Records
Map
Nearby Homes
- 9409 Aldabra Ct
- 9845 Paseo Montalban
- 9757 Caminito Cuadro
- 9858 Via Caceres
- 9832 Caminito Cuadro
- 9501 High Park Ln
- 9881 Caminito Cuadro
- 9959 Riverhead Dr
- 9665 Palm Beach Ln
- 13584 Freeport Rd
- 9562 Stargaze Ave
- 10118 Freeport Ct
- 13134 Cayote Ave
- 12987 La Tortola
- 8985 Talca Ct
- 13865 Freeport Rd
- 13146 Thunderhead St
- 12933 Rife Way
- 13243 Boomer Ct
- 12924 Via Caballo Rojo
- 13680 Via Cima Bella
- 13672 Via Cima Bella
- 13688 Via Cima Bella
- 13696 Via Cima Bella
- 13664 Via Cima Bella
- 13455 Black Hills Rd
- 13706 Via Cima Bella
- 13459 Black Hills Rd
- 13656 Via Cima Bella
- 13451 Black Hills Rd
- 13685 Via Cima Bella
- 13463 Black Hills Rd
- 13673 Via Cima Bella
- 9507 Vista Tercera
- 13712 Via Cima Bella
- 13447 Black Hills Rd
- 13648 Via Cima Bella
- 9513 Vista Tercera
- 13471 Black Hills Rd
- 9505 Via Pereza