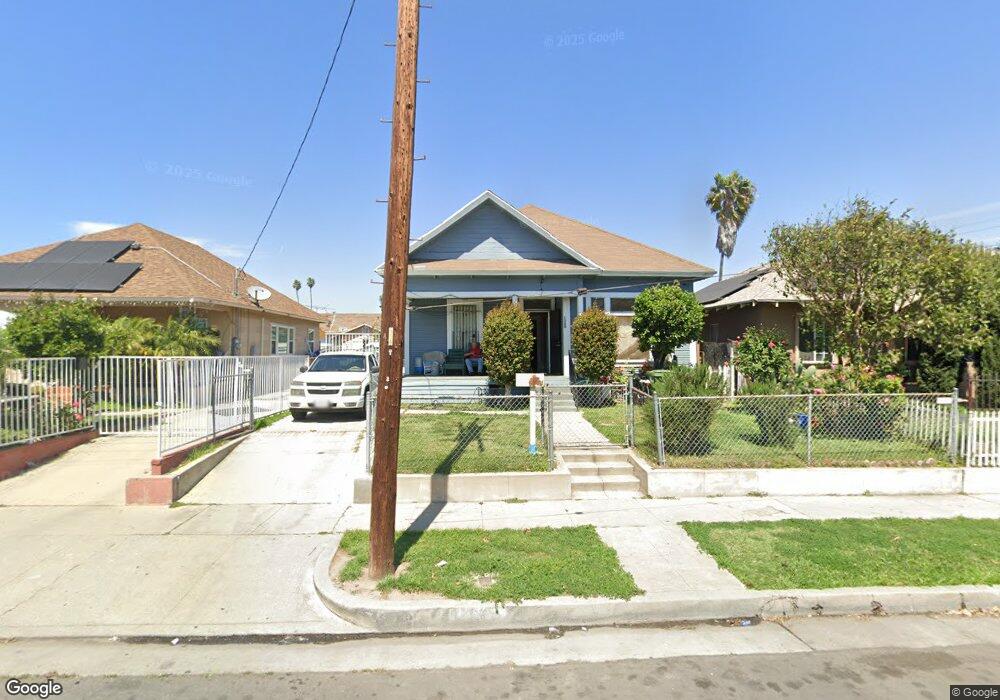
1369 E 53rd St Los Angeles, CA 90011
Central Alameda NeighborhoodEstimated Value: $541,000 - $679,000
2
Beds
2
Baths
1,228
Sq Ft
$497/Sq Ft
Est. Value
About This Home
This home is located at 1369 E 53rd St, Los Angeles, CA 90011 and is currently estimated at $610,395, approximately $497 per square foot. 1369 E 53rd St is a home located in Los Angeles County with nearby schools including Hooper Avenue Elementary School, Los Angeles Academy Middle School, and Nava College Preparatory Academy.
Ownership History
Date
Name
Owned For
Owner Type
Purchase Details
Closed on
Jun 27, 1997
Sold by
Ortiz Librada
Bought by
Reyes Antoquio
Current Estimated Value
Home Financials for this Owner
Home Financials are based on the most recent Mortgage that was taken out on this home.
Original Mortgage
$82,708
Interest Rate
4.95%
Purchase Details
Closed on
May 14, 1997
Sold by
Hud
Bought by
Reyes Antoquio
Home Financials for this Owner
Home Financials are based on the most recent Mortgage that was taken out on this home.
Original Mortgage
$82,708
Interest Rate
4.95%
Purchase Details
Closed on
Aug 21, 1996
Sold by
Norwest Mtg Inc
Bought by
Hud
Purchase Details
Closed on
Nov 16, 1995
Sold by
Quevedo Hugo
Bought by
New Haven Corp
Purchase Details
Closed on
Nov 15, 1994
Sold by
Medrano Luis
Bought by
Quevedo Hugo
Purchase Details
Closed on
Nov 15, 1993
Sold by
Garcia Alva Marina
Bought by
Medrano Luis
Create a Home Valuation Report for This Property
The Home Valuation Report is an in-depth analysis detailing your home's value as well as a comparison with similar homes in the area
Home Values in the Area
Average Home Value in this Area
Purchase History
We collect this data history from publicly available records. To have your information removed, we recommend requesting removal directly through your county’s website.
| Date | Buyer | Sale Price | Title Company |
|---|---|---|---|
| Reyes Antoquio | -- | California Counties Title Co | |
| Reyes Antoquio | $92,000 | California Counties Title Co | |
| Hud | -- | -- | |
| Norwest Mtg Inc | $121,672 | Stewart Title | |
| New Haven Corp | -- | -- | |
| Quevedo Hugo | -- | -- | |
| Medrano Luis | -- | Investors Title Company | |
| Quevedo Hugo | -- | Investors Title Company |
Source: Public Records
Mortgage History
We collect this data history from publicly available records. To have your information removed, we recommend requesting removal directly through your county’s website.
| Date | Status | Borrower | Loan Amount |
|---|---|---|---|
| Previous Owner | Reyes Antoquio | $82,708 |
Source: Public Records
Tax History
| Year | Tax Paid | Tax Assessment Tax Assessment Total Assessment is a certain percentage of the fair market value that is determined by local assessors to be the total taxable value of land and additions on the property. | Land | Improvement |
|---|---|---|---|---|
| 2025 | $2,002 | $146,871 | $103,774 | $43,097 |
| 2024 | $2,002 | $143,992 | $101,740 | $42,252 |
| 2023 | $1,968 | $141,170 | $99,746 | $41,424 |
| 2022 | $1,882 | $138,403 | $97,791 | $40,612 |
| 2021 | $1,854 | $135,690 | $95,874 | $39,816 |
| 2019 | $1,803 | $131,667 | $93,031 | $38,636 |
| 2018 | $1,733 | $129,086 | $91,207 | $37,879 |
| 2016 | $1,645 | $124,075 | $87,666 | $36,409 |
| 2015 | $1,624 | $122,213 | $86,350 | $35,863 |
| 2014 | $1,637 | $119,820 | $84,659 | $35,161 |
Source: Public Records
Map
Nearby Homes
- 1423 E 52nd St
- 1454 E 50th St
- 1458 E 50th St Unit 4
- 1407 E 50th St
- 5110 Compton Ave
- 5426 Compton Ave
- 1266 E 50th St
- 1320 E 48th St
- 1150 E 51st St
- 1259 E 49th St
- 1462 E 57th St
- 1141 E 50th St
- 1192 E 48th St
- 4610 Compton Ave
- 4801 S Central Ave
- 904 E 52nd Place
- 1362 E Vernon Ave
- 1348 E Vernon Ave
- 920 E 48th St
- 871 E 49th St
- 1363 E 53rd St
- 1379 E 53rd St
- 5217 Ascot Ave
- 1355 E 53rd St
- 5211 Ascot Ave
- 1351 E 53rd St
- 5209 Ascot Ave
- 1343 E 53rd St
- 5222 Latham St
- 1370 E 53rd St
- 5208 Ascot Ave
- 5207 Ascot Ave
- 5218 Latham St Unit 4
- 5218 Latham St
- 1352 E 53rd St Unit A - B
- 1352 E 53rd St
- 1407 E 53rd St
- 1335 E 53rd St
- 1346 E 53rd St
- 1413 E 53rd St Unit 14
Your Personal Tour Guide
Ask me questions while you tour the home.