


Estimated payment $2,298/month
Highlights
- Beach Access
- Lake Privileges
- Ground Level Unit
- Wixom Elementary School Rated A
- Colonial Architecture
- 2 Car Attached Garage
About This Home
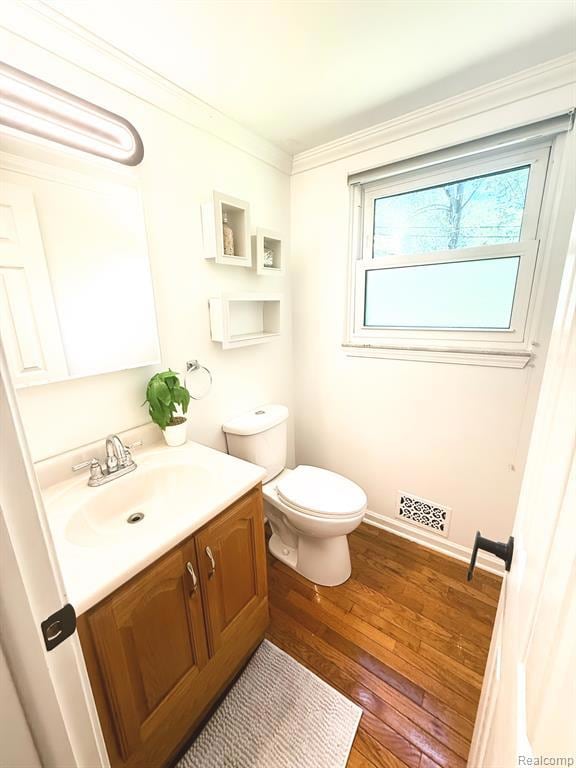
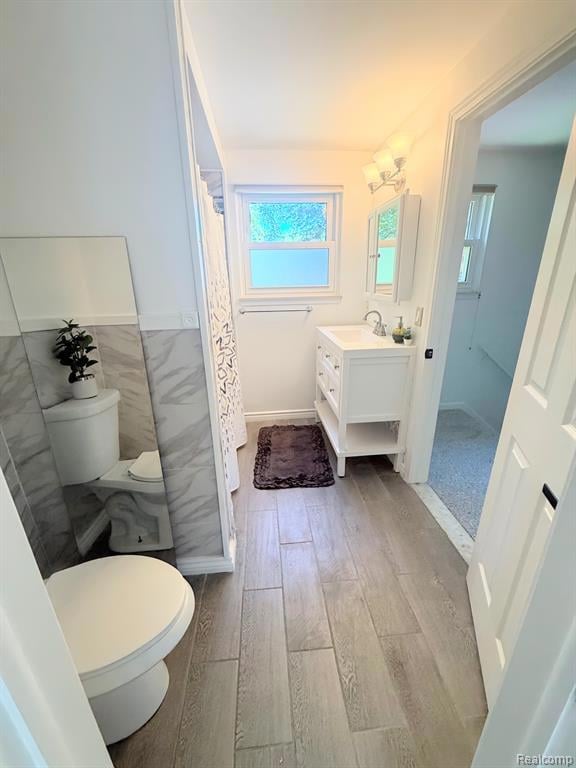
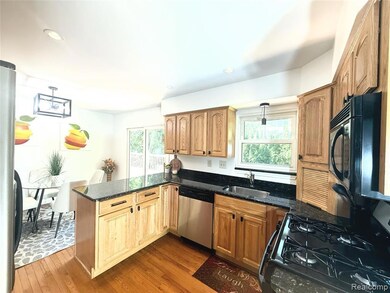
Absolutely stunning Colonial featuring 3 spacious bedrooms and 1.5 designer baths, set on a serene park-like lot. Enjoy luxury living with a 2-car attached garage, inviting front and back decks, newer windows, roof, and siding, plus a chef’s kitchen with granite countertops and high-end stainless steel appliances—both bathrooms are beautifully updated. This one is a showstopper—show and sell! Lake access Agent is Owner
Listing Agent
Real Estate One-Northville License #6501329185 Listed on: 12/01/2025

Home Details
Home Type
- Single Family
Est. Annual Taxes
Year Built
- Built in 1971 | Remodeled in 2025
Lot Details
- 0.29 Acre Lot
- Lot Dimensions are 100 x 125
Parking
- 2 Car Attached Garage
Home Design
- Colonial Architecture
- Brick Exterior Construction
- Block Foundation
- Vinyl Construction Material
Interior Spaces
- 1,600 Sq Ft Home
- 2-Story Property
- Partially Finished Basement
- Sump Pump
Bedrooms and Bathrooms
- 3 Bedrooms
Outdoor Features
- Beach Access
- Lake Privileges
Location
- Ground Level Unit
Utilities
- Forced Air Heating System
- Heating System Uses Natural Gas
Community Details
- Property has a Home Owners Association
- Birch Park Association, Phone Number (313) 737-6540
Listing and Financial Details
- Assessor Parcel Number 1729378016
Map
Home Values in the Area
Average Home Value in this Area
Tax History
| Year | Tax Paid | Tax Assessment Tax Assessment Total Assessment is a certain percentage of the fair market value that is determined by local assessors to be the total taxable value of land and additions on the property. | Land | Improvement |
|---|---|---|---|---|
| 2024 | $2,979 | $142,420 | $0 | $0 |
| 2023 | $2,848 | $127,200 | $0 | $0 |
| 2022 | $2,844 | $112,220 | $0 | $0 |
| 2021 | $2,792 | $110,420 | $0 | $0 |
| 2020 | $2,683 | $103,430 | $0 | $0 |
| 2019 | $2,808 | $95,170 | $0 | $0 |
| 2018 | $2,726 | $92,670 | $0 | $0 |
| 2017 | $2,514 | $92,710 | $0 | $0 |
| 2016 | $2,395 | $88,510 | $0 | $0 |
| 2015 | -- | $76,420 | $0 | $0 |
| 2014 | -- | $65,940 | $0 | $0 |
| 2011 | -- | $60,840 | $0 | $0 |
Property History
| Date | Event | Price | List to Sale | Price per Sq Ft |
|---|---|---|---|---|
| 12/01/2025 12/01/25 | For Sale | $389,900 | -- | $244 / Sq Ft |
Purchase History
| Date | Type | Sale Price | Title Company |
|---|---|---|---|
| Warranty Deed | $250,000 | None Listed On Document | |
| Warranty Deed | $250,000 | None Listed On Document | |
| Warranty Deed | $145,000 | Interstate Title Inc | |
| Interfamily Deed Transfer | -- | None Available | |
| Interfamily Deed Transfer | -- | None Available |
Mortgage History
| Date | Status | Loan Amount | Loan Type |
|---|---|---|---|
| Open | $256,000 | New Conventional | |
| Closed | $256,000 | New Conventional |
Source: Realcomp
MLS Number: 20251057123
APN: 17-29-378-016
Disclaimer: Certain information contained herein is derived from information provided by parties other than Homes.com. All information provided is deemed reliable, but is not guaranteed to be accurate and should be independently verified.
![]() IDX provided courtesy of Realcomp II Ltd. via Ten-X and MLS
IDX provided courtesy of Realcomp II Ltd. via Ten-X and MLS
Copyright 2025 Realcomp II Ltd. Shareholders
IDX information is provided exclusively for consumers' personal, noncommercial use and may not be used for any purpose other than to identify prospective properties consumers may be interested in purchasing. The accuracy of all information, regardless of source, is not guaranteed or warranted. All information should be independently verified.
Listing Information presented by local MLS brokerage: Ten-X, local REALTOR®- Arlene Richardson - (888)-952-6393
- 1470 Nightingale
- 1445 Mariposa Dr
- 1255 Andover Dr
- 2759 Maple Forest Dr Unit 84
- 2588 Maple Forest Ct
- 746 Red Maple Ln
- 1432 Pond View Ct
- 2750 Maple Forest Dr
- 3184 Roma Ct
- 3202 Roma Ct
- 3201 Roma Ct
- 691 Chestnut Dr Unit 24
- 913 Rikki Ann Ct
- 2015 Lamella
- 1535 Kings Crown Ct
- 882 Natures Cove Ct
- 2225 Silvermaple Ct
- 1615 Brentwood Dr
- 2406 Madison St
- 2988 Theodore
- 3202 Roma Ct
- 2739 Lakeridge
- 834 Natures Cove Ct Unit 6
- 2063 Shearwater Cir
- 20209 Chesapeake Cir Unit 230
- 12200 Chesapeake Cir Unit 133
- 8208 Chesapeake Cir Unit 95
- 17208 Chesapeake Cir Unit 197
- 3142 Johanna Ware W
- 355 Beck Rd
- 48200 Pontiac Trail
- 31071 Lakeview Blvd
- 30900 Tamarack St
- 30951 Stone Ridge Dr
- 16211 Addington Dr Unit 192
- 3201 Addington Dr Unit 30
- 8104 Addington Dr
- 31170 Wellington Dr
- 45685 Timberlane Ct
- 30995 Springlake Blvd