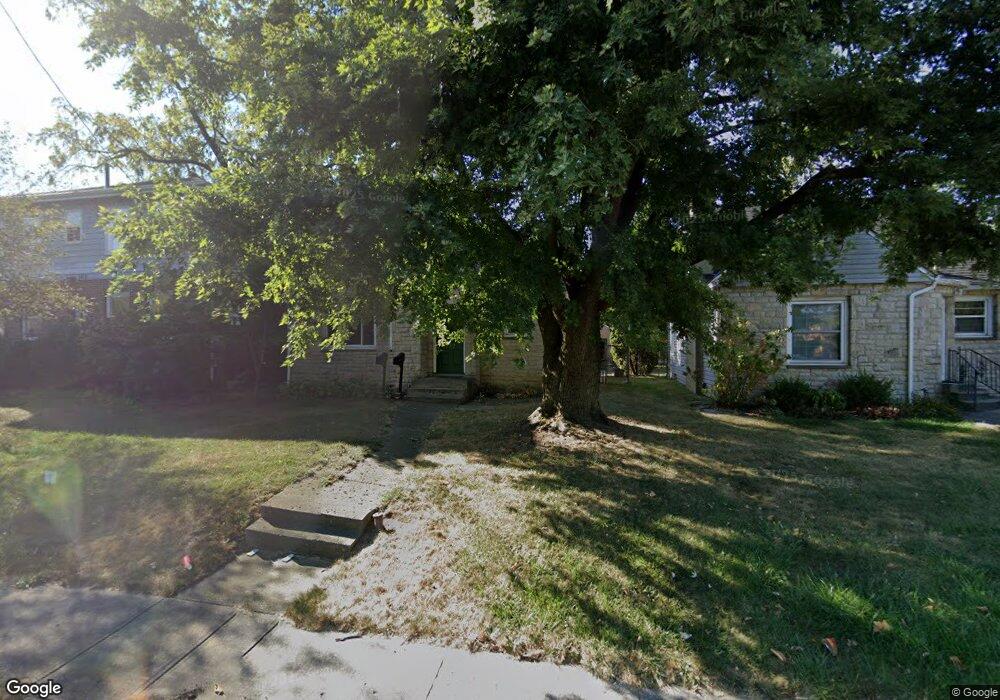
137 Morse Rd Columbus, OH 43214
Clintonville NeighborhoodEstimated Value: $253,000 - $345,991
3
Beds
1
Bath
1,447
Sq Ft
$213/Sq Ft
Est. Value
About This Home
This home is located at 137 Morse Rd, Columbus, OH 43214 and is currently estimated at $308,748, approximately $213 per square foot. 137 Morse Rd is a home located in Franklin County with nearby schools including Indian Springs Elementary School, Dominion Middle School, and Whetstone High School.
Ownership History
Date
Name
Owned For
Owner Type
Purchase Details
Closed on
Jun 24, 2002
Sold by
Schuh Laura D and Schuh Laura D
Bought by
Shinn Brian Edward and Shinn Brian E
Current Estimated Value
Home Financials for this Owner
Home Financials are based on the most recent Mortgage that was taken out on this home.
Original Mortgage
$103,174
Outstanding Balance
$42,643
Interest Rate
6.91%
Mortgage Type
FHA
Estimated Equity
$266,105
Purchase Details
Closed on
Apr 24, 1995
Sold by
P D P Inc
Bought by
Laura D Schuh
Home Financials for this Owner
Home Financials are based on the most recent Mortgage that was taken out on this home.
Original Mortgage
$83,350
Interest Rate
8.64%
Mortgage Type
FHA
Purchase Details
Closed on
Nov 13, 1992
Create a Home Valuation Report for This Property
The Home Valuation Report is an in-depth analysis detailing your home's value as well as a comparison with similar homes in the area
Home Values in the Area
Average Home Value in this Area
Purchase History
| Date | Buyer | Sale Price | Title Company |
|---|---|---|---|
| Shinn Brian Edward | $104,000 | Preferred Title Agency Inc | |
| Laura D Schuh | $83,900 | -- | |
| -- | $31,000 | -- |
Source: Public Records
Mortgage History
| Date | Status | Borrower | Loan Amount |
|---|---|---|---|
| Open | Shinn Brian Edward | $103,174 | |
| Previous Owner | Laura D Schuh | $83,350 |
Source: Public Records
Tax History
| Year | Tax Paid | Tax Assessment Tax Assessment Total Assessment is a certain percentage of the fair market value that is determined by local assessors to be the total taxable value of land and additions on the property. | Land | Improvement |
|---|---|---|---|---|
| 2025 | $4,658 | $103,780 | $41,300 | $62,480 |
| 2024 | $4,658 | $103,780 | $41,300 | $62,480 |
| 2023 | $4,598 | $103,775 | $41,300 | $62,475 |
| 2022 | $3,948 | $76,130 | $25,030 | $51,100 |
| 2021 | $3,955 | $76,130 | $25,030 | $51,100 |
| 2020 | $3,961 | $76,130 | $25,030 | $51,100 |
| 2019 | $3,669 | $60,480 | $19,250 | $41,230 |
| 2018 | $1,831 | $60,480 | $19,250 | $41,230 |
| 2017 | $3,667 | $60,480 | $19,250 | $41,230 |
| 2016 | $2,785 | $42,040 | $14,980 | $27,060 |
| 2015 | $1,264 | $42,040 | $14,980 | $27,060 |
| 2014 | $2,534 | $42,040 | $14,980 | $27,060 |
| 2013 | $1,190 | $40,040 | $14,280 | $25,760 |
Source: Public Records
Map
Nearby Homes
- 140 E Beechwold Blvd
- 289 E Royal Forest Blvd
- 312 E Royal Forest Blvd
- 327 E Jeffrey Place
- 387 Morse Rd
- 420 E Beechwold Blvd
- 262 Leland Ave
- 522 E Beechwold Blvd
- 151 W Dominion Blvd
- 528 E Beechwold Blvd
- 243 E Schreyer Place
- 211 Garrett Place
- 5200 Fenway Ct Unit B
- 68 W Kanawha Ave
- 33 Rosslyn Ave
- 109 W Schreyer Place
- 252 W Kanawha Ave
- 131 E Stanton Ave
- 205 W Henderson Rd
- 139 Aldrich Rd
- 133 Morse Rd
- 143 Morse Rd
- 149 Morse Rd
- 125 Morse Rd
- 155 Morse Rd
- 115 Morse Rd
- 140 E Jeffrey Place
- 123 Morse Rd
- 144 E Jeffrey Place
- 159 Morse Rd
- 128 E Jeffrey Place
- 150 E Jeffrey Place
- 156 E Jeffrey Place
- 111 Morse Rd
- 165 Morse Rd
- 118 E Jeffrey Place
- 160 E Jeffrey Place
- 132 Morse Rd
- 105 Morse Rd
- 167 Morse Rd
Your Personal Tour Guide
Ask me questions while you tour the home.