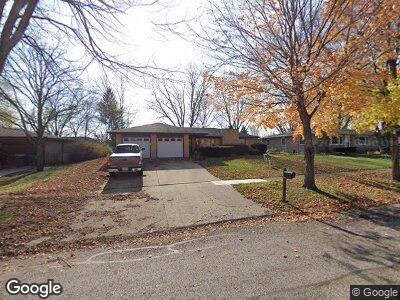
137 Neil Rd Unit 3 Sugar Grove, IL 60554
Estimated Value: $309,390 - $326,000
3
Beds
--
Bath
1,384
Sq Ft
$230/Sq Ft
Est. Value
About This Home
This home is located at 137 Neil Rd Unit 3, Sugar Grove, IL 60554 and is currently estimated at $318,348, approximately $230 per square foot. 137 Neil Rd Unit 3 is a home located in Kane County with nearby schools including Kaneland John Shields Elementary School, Harter Middle School, and Kaneland Senior High School.
Ownership History
Date
Name
Owned For
Owner Type
Purchase Details
Closed on
Apr 29, 1998
Sold by
Tindall Victor and Tindall Orlena M
Bought by
Tindall Byford and Tindall Carol
Current Estimated Value
Home Financials for this Owner
Home Financials are based on the most recent Mortgage that was taken out on this home.
Original Mortgage
$104,000
Interest Rate
7.19%
Create a Home Valuation Report for This Property
The Home Valuation Report is an in-depth analysis detailing your home's value as well as a comparison with similar homes in the area
Home Values in the Area
Average Home Value in this Area
Purchase History
| Date | Buyer | Sale Price | Title Company |
|---|---|---|---|
| Tindall Byford | $130,000 | -- |
Source: Public Records
Mortgage History
| Date | Status | Borrower | Loan Amount |
|---|---|---|---|
| Open | Tindall Byford L | $70,000 | |
| Closed | Tindall Byford | $82,573 | |
| Closed | Tindall Byford | $75,000 | |
| Closed | Tindall Byford L | $98,349 | |
| Closed | Tindall Byford | $50,000 | |
| Closed | Tindall Byford | $15,000 | |
| Closed | Tindall Byford L | $10,000 | |
| Closed | Tindall Byford | $104,000 |
Source: Public Records
Tax History Compared to Growth
Tax History
| Year | Tax Paid | Tax Assessment Tax Assessment Total Assessment is a certain percentage of the fair market value that is determined by local assessors to be the total taxable value of land and additions on the property. | Land | Improvement |
|---|---|---|---|---|
| 2023 | $7,400 | $88,758 | $21,868 | $66,890 |
| 2022 | $7,159 | $81,940 | $20,188 | $61,752 |
| 2021 | $6,892 | $77,979 | $19,212 | $58,767 |
| 2020 | $6,790 | $76,315 | $18,802 | $57,513 |
| 2019 | $6,679 | $73,820 | $18,187 | $55,633 |
| 2018 | $6,715 | $72,515 | $17,482 | $55,033 |
| 2017 | $6,501 | $69,254 | $16,696 | $52,558 |
| 2016 | $6,338 | $66,202 | $15,960 | $50,242 |
| 2015 | -- | $61,594 | $14,849 | $46,745 |
| 2014 | -- | $58,897 | $14,199 | $44,698 |
| 2013 | -- | $59,516 | $14,348 | $45,168 |
Source: Public Records
Map
Nearby Homes
- 84 Terry Dr
- 163 S Main St
- 327 Mallard Ln
- 574 Brookhaven Cir
- 150 Meadows Ct Unit 1
- 369 Mallard Ln
- 384 Edgewater Ct
- 220 Brompton Ln Unit B
- 236 Berkshire Ln
- 230 Brompton Ln Unit B
- 240 Regency Blvd Unit 1
- 1130 Cone Flower Cir
- 160 Isbell Dr
- 518 Mallard Ln Unit F
- 1218 Mariemont Rd Unit C
- 99 Atkinson Dr
- 319 Carole St
- 1310 Airs Ave
- 216 W Park Ave Unit A
- 112 Sutton Ave Unit 1