
Seller's Agent in 2024
SANDRA OSPINA
Ospina Sandra A
(917) 257-4169
1 in this area
2 Total Sales
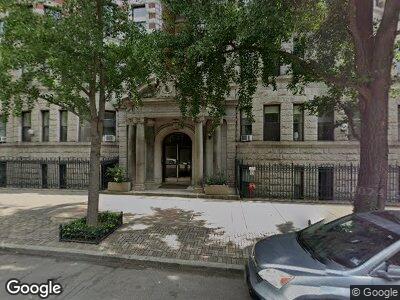
This spacious 1 BEDROOM in a prewar landmark Condo has everything to offer: location across from Central Park, 180 degrees of City Views, Spacious Windowed Eat In Kitchen with Renovated with new SS Appliances,
The apartment is quiet & bathed throughout with natural light during the day from its northern exposure.
There are Newly sanded and polished Hardwood Floors Throughout the Hi Ceiling Apartment.
The large Premium Windowed Eat-In Kitchen with Stainless Steel Appliances, amazing northern city views and accommodates a sizable dining table for guests.
The generously sized master bedroom fits a king size bed as well as additional furniture (desk, chairs, a crib, or an armoire).
Building Amenities: This Central Park North Condo Building offers a Part-Time Doorman and Superintendent. Video Intercom. Laundry on site.
Available May 01, 2024 . Other Units Available soon.
Transportation: half a block to 2,3 and B.C trains. Catch the cross-town buses. 2, 3 & 4 on the corner. Citi-bikes half a block away.
Simple & quick application process, No Board Approval.
Rarely available!
Photos are of another unit in the same A Line.
No Pets Allowed.
Schedule an appointment at your convenience.
BROKERS CYOF
Building Amenities: This Central Park North Condo Building offers a Part-Time Doorman and Superintendent. Video Intercom. Laundry on site.
| Date | Event | Price | Change | Sq Ft Price |
|---|---|---|---|---|
| 06/14/2024 06/14/24 | Rented | $3,250 | 0.0% | -- |
| 06/01/2024 06/01/24 | For Rent | $3,250 | +8.3% | -- |
| 05/24/2024 05/24/24 | Rented | $3,000 | -7.7% | -- |
| 04/21/2024 04/21/24 | For Rent | $3,250 | -- | -- |
| Year | Tax Paid | Tax Assessment Tax Assessment Total Assessment is a certain percentage of the fair market value that is determined by local assessors to be the total taxable value of land and additions on the property. | Land | Improvement |
|---|---|---|---|---|
| 2024 | $8,375 | $66,987 | $7,970 | $59,017 |
| 2023 | $8,020 | $65,376 | $7,970 | $57,406 |
| 2022 | $7,833 | $66,983 | $7,970 | $59,013 |
| 2021 | $7,498 | $62,498 | $7,970 | $54,528 |
| 2020 | $7,483 | $71,310 | $7,970 | $63,340 |
| 2019 | $7,130 | $69,253 | $7,970 | $61,283 |
| 2018 | $6,547 | $61,475 | $7,970 | $53,505 |
| 2017 | $6,281 | $58,811 | $7,970 | $50,841 |
| 2016 | $5,941 | $53,415 | $7,969 | $45,446 |
| 2015 | $3,424 | $48,469 | $7,969 | $40,500 |
| 2014 | $3,424 | $45,637 | $7,970 | $37,667 |
Seller's Agent in 2024
SANDRA OSPINA
Ospina Sandra A
(917) 257-4169
1 in this area
2 Total Sales