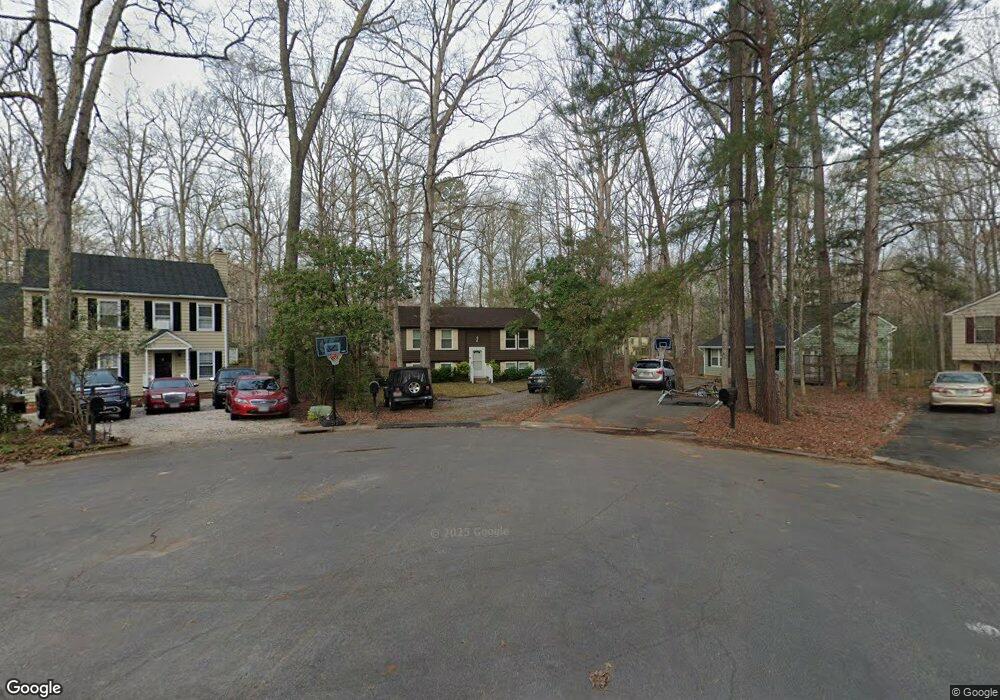
13706 Carriage Creek Place Midlothian, VA 23112
Estimated Value: $314,000 - $351,488
3
Beds
2
Baths
1,758
Sq Ft
$191/Sq Ft
Est. Value
About This Home
This home is located at 13706 Carriage Creek Place, Midlothian, VA 23112 and is currently estimated at $335,372, approximately $190 per square foot. 13706 Carriage Creek Place is a home located in Chesterfield County with nearby schools including Swift Creek Elementary School, Swift Creek Middle, and Clover Hill High.
Ownership History
Date
Name
Owned For
Owner Type
Purchase Details
Closed on
Jul 22, 2009
Sold by
Woodson Zachary Ray
Bought by
Blackburn Jonathan M
Current Estimated Value
Home Financials for this Owner
Home Financials are based on the most recent Mortgage that was taken out on this home.
Original Mortgage
$173,794
Outstanding Balance
$114,975
Interest Rate
5.58%
Mortgage Type
FHA
Estimated Equity
$220,397
Purchase Details
Closed on
Mar 10, 2005
Sold by
Burget David L
Bought by
Woodson Zachary Ray and Hartman,Julie
Home Financials for this Owner
Home Financials are based on the most recent Mortgage that was taken out on this home.
Original Mortgage
$149,380
Interest Rate
5.56%
Mortgage Type
New Conventional
Purchase Details
Closed on
Jan 14, 2002
Bought by
Burget David L
Home Financials for this Owner
Home Financials are based on the most recent Mortgage that was taken out on this home.
Original Mortgage
$55,758
Interest Rate
7.04%
Mortgage Type
FHA
Create a Home Valuation Report for This Property
The Home Valuation Report is an in-depth analysis detailing your home's value as well as a comparison with similar homes in the area
Home Values in the Area
Average Home Value in this Area
Purchase History
| Date | Buyer | Sale Price | Title Company |
|---|---|---|---|
| Blackburn Jonathan M | $177,000 | -- | |
| Woodson Zachary Ray | $154,000 | -- | |
| Burget David L | -- | -- |
Source: Public Records
Mortgage History
| Date | Status | Borrower | Loan Amount |
|---|---|---|---|
| Open | Blackburn Jonathan M | $173,794 | |
| Previous Owner | Woodson Zachary Ray | $149,380 | |
| Previous Owner | Burget David L | $55,758 |
Source: Public Records
Tax History Compared to Growth
Tax History
| Year | Tax Paid | Tax Assessment Tax Assessment Total Assessment is a certain percentage of the fair market value that is determined by local assessors to be the total taxable value of land and additions on the property. | Land | Improvement |
|---|---|---|---|---|
| 2025 | $2,590 | $288,200 | $70,000 | $218,200 |
| 2024 | $2,590 | $270,400 | $70,000 | $200,400 |
| 2023 | $2,386 | $262,200 | $64,000 | $198,200 |
| 2022 | $2,167 | $235,500 | $54,000 | $181,500 |
| 2021 | $2,086 | $212,600 | $52,000 | $160,600 |
| 2020 | $1,914 | $201,500 | $51,000 | $150,500 |
| 2019 | $1,824 | $192,000 | $48,000 | $144,000 |
| 2018 | $1,687 | $177,600 | $45,000 | $132,600 |
| 2017 | $1,609 | $167,600 | $42,000 | $125,600 |
| 2016 | $1,530 | $159,400 | $42,000 | $117,400 |
| 2015 | $1,504 | $154,100 | $42,000 | $112,100 |
| 2014 | $1,471 | $150,600 | $40,500 | $110,100 |
Source: Public Records
Map
Nearby Homes
- 2503 Crosstimbers Ct
- 2306 Arrowood Rd
- 13830 Crosstimbers Rd
- 2800 Fox Chase Ln
- 2952 Woodbridge Crossing Dr Unit 2952
- 13712 Woodbridge Crossing Way
- 13914 Sagebrook Rd
- 3121 Quail Hill Dr
- 2206 Turtle Hill Ln
- 2604 Whispering Oaks Terrace
- 3201 Fox Chase Rd
- 3208 Quail Hill Dr
- 3301 Old Hundred Rd S
- 3201 Barnes Spring Ct
- 3212 Fox Chase Dr
- 13700 Quail Meadows Ln
- 1255 Lazy River Rd
- 12918 Mill Meadow Ct
- 14007 Millpointe Rd Unit 16C
- 14352 Altavista Blvd
- 13704 Carriage Creek Place
- 13702 Carriage Creek Place
- 13705 Carriage Creek Place
- 13700 Carriage Creek Place
- 13703 Carriage Creek Place
- 13701 Carriage Creek Place
- 2507 Crosstimbers Ct
- 2509 Crosstimbers Ct
- 2505 Crosstimbers Ct
- 2410 Arrowood Rd
- 2412 Arrowood Rd
- 2511 Crosstimbers Ct
- 2420 Carriage Creek Rd
- 2501 Crosstimbers Ct
- 2413 Arrowood Rd
- 2418 Carriage Creek Rd
- 2506 Carriage Creek Ct
- 2408 Arrowood Rd
- 2504 Carriage Creek Ct
- 2513 Crosstimbers Ct