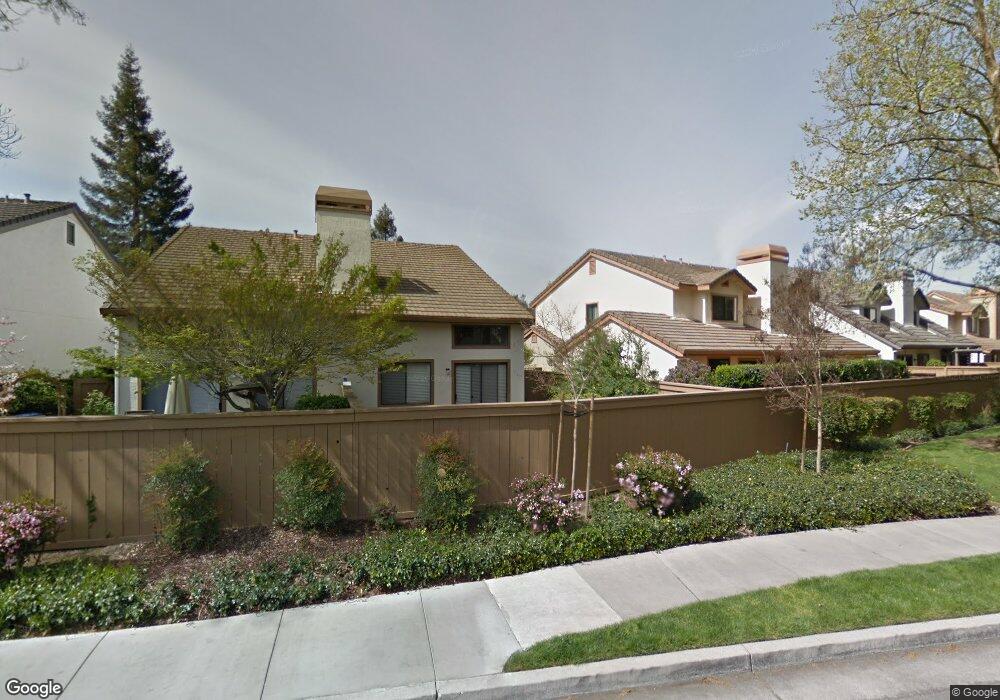
1371 Keenan Way San Jose, CA 95125
Willow Glen NeighborhoodEstimated Value: $1,117,000 - $1,339,000
3
Beds
3
Baths
1,444
Sq Ft
$845/Sq Ft
Est. Value
About This Home
This home is located at 1371 Keenan Way, San Jose, CA 95125 and is currently estimated at $1,220,148, approximately $844 per square foot. 1371 Keenan Way is a home located in Santa Clara County with nearby schools including Del Mar High School, Blackford Elementary, and Sherman Oaks Elementary School.
Ownership History
Date
Name
Owned For
Owner Type
Purchase Details
Closed on
Sep 3, 2015
Sold by
Davila Nick A
Bought by
Davila Nick A and Masegian Davila Christy D
Current Estimated Value
Home Financials for this Owner
Home Financials are based on the most recent Mortgage that was taken out on this home.
Original Mortgage
$438,000
Outstanding Balance
$344,020
Interest Rate
3.91%
Mortgage Type
New Conventional
Estimated Equity
$876,128
Purchase Details
Closed on
Jun 2, 2009
Sold by
Berdahl Eric M
Bought by
Davila Nick A
Home Financials for this Owner
Home Financials are based on the most recent Mortgage that was taken out on this home.
Original Mortgage
$480,260
Interest Rate
4.78%
Mortgage Type
FHA
Purchase Details
Closed on
Dec 15, 2008
Sold by
Olsen Christina L
Bought by
Berdahl Eric M
Home Financials for this Owner
Home Financials are based on the most recent Mortgage that was taken out on this home.
Original Mortgage
$356,000
Interest Rate
6.1%
Mortgage Type
New Conventional
Purchase Details
Closed on
Nov 12, 2001
Sold by
Markus Morris Charla
Bought by
Berdahl Eric M
Home Financials for this Owner
Home Financials are based on the most recent Mortgage that was taken out on this home.
Original Mortgage
$365,625
Interest Rate
6.5%
Purchase Details
Closed on
Feb 20, 2001
Sold by
Markus Morris Charla
Bought by
Markus Morris Charla
Home Financials for this Owner
Home Financials are based on the most recent Mortgage that was taken out on this home.
Original Mortgage
$253,500
Interest Rate
6.98%
Purchase Details
Closed on
Sep 21, 1999
Sold by
Morris Stephen J
Bought by
Markus Morris Charla
Home Financials for this Owner
Home Financials are based on the most recent Mortgage that was taken out on this home.
Original Mortgage
$230,000
Interest Rate
8.09%
Purchase Details
Closed on
Sep 20, 1999
Sold by
Reigel Bradley D and Maupas Lori E
Bought by
Markus Morris Charla
Home Financials for this Owner
Home Financials are based on the most recent Mortgage that was taken out on this home.
Original Mortgage
$230,000
Interest Rate
8.09%
Purchase Details
Closed on
Oct 30, 1998
Sold by
Edwards Thomas C and Edwards Gloria L
Bought by
Edwards Thomas C and Edwards Gloria Mink
Purchase Details
Closed on
Feb 1, 1995
Sold by
Jones Franklin C and Jones Laleh S
Bought by
Reigel Bradley D and Maupas Lori E
Home Financials for this Owner
Home Financials are based on the most recent Mortgage that was taken out on this home.
Original Mortgage
$208,800
Interest Rate
9.27%
Create a Home Valuation Report for This Property
The Home Valuation Report is an in-depth analysis detailing your home's value as well as a comparison with similar homes in the area
Home Values in the Area
Average Home Value in this Area
Purchase History
| Date | Buyer | Sale Price | Title Company |
|---|---|---|---|
| Davila Nick A | -- | North American Title Company | |
| Davila Nick A | $510,000 | First American Title Company | |
| Berdahl Eric M | -- | Fidelity National Title Co | |
| Berdahl Eric M | -- | North American Title Co | |
| Markus Morris Charla | -- | Chicago Title Co | |
| Markus Morris Charla | -- | Chicago Title Co | |
| Markus Morris Charla | $345,000 | Chicago Title Co | |
| Edwards Thomas C | -- | -- | |
| Reigel Bradley D | $232,000 | First American Title Guarant |
Source: Public Records
Mortgage History
| Date | Status | Borrower | Loan Amount |
|---|---|---|---|
| Open | Davila Nick A | $438,000 | |
| Closed | Davila Nick A | $480,260 | |
| Previous Owner | Berdahl Eric M | $356,000 | |
| Previous Owner | Berdahl Eric M | $365,625 | |
| Previous Owner | Markus Morris Charla | $253,500 | |
| Previous Owner | Markus Morris Charla | $230,000 | |
| Previous Owner | Reigel Bradley D | $208,800 |
Source: Public Records
Tax History Compared to Growth
Tax History
| Year | Tax Paid | Tax Assessment Tax Assessment Total Assessment is a certain percentage of the fair market value that is determined by local assessors to be the total taxable value of land and additions on the property. | Land | Improvement |
|---|---|---|---|---|
| 2025 | $9,268 | $656,740 | $328,370 | $328,370 |
| 2024 | $9,268 | $643,864 | $321,932 | $321,932 |
| 2023 | $9,268 | $631,240 | $315,620 | $315,620 |
| 2022 | $9,039 | $618,864 | $309,432 | $309,432 |
| 2021 | $8,848 | $606,730 | $303,365 | $303,365 |
| 2020 | $8,604 | $600,510 | $300,255 | $300,255 |
| 2019 | $8,486 | $588,736 | $294,368 | $294,368 |
| 2018 | $8,254 | $577,194 | $288,597 | $288,597 |
| 2017 | $8,149 | $565,878 | $282,939 | $282,939 |
| 2016 | $7,698 | $554,784 | $277,392 | $277,392 |
| 2015 | $7,592 | $546,452 | $273,226 | $273,226 |
| 2014 | $6,987 | $535,748 | $267,874 | $267,874 |
Source: Public Records
Map
Nearby Homes
- 1874 Huxley Ct
- 1932 Huxley Ct
- 2043 Sonador Commons
- 2067 Sonador Commons
- 1831 Ashmeade Ct
- 1405 Allegado Alley Unit 86
- 1990 Southwest Expy
- 90 Quail Hollow Dr Unit 90
- 1721 Braddock Ct
- 1751 Braddock Ct
- 177 Quail Hollow Dr Unit 117
- 26 Quail Hollow Dr Unit 26
- 138 Quail Hollow Dr Unit 138
- 1566 Stokes St
- 1182 Leigh Ave
- 1445 S Bascom Ave Unit 47
- 1515 Rhinecliff Way
- 160 Quail Hollow Dr Unit 160A
- 1492 Aurelian Ln
- 912 Campisi Way Unit 115
- 1369 Keenan Way
- 1367 Keenan Way
- 1365 Keenan Way
- 1412 Beringer Ct
- 1410 Beringer Ct
- 1408 Beringer Ct
- 1363 Keenan Way
- 1406 Beringer Ct
- 1361 Keenan Way
- 2018 Wente Place
- 2020 Wente Place
- 1370 Keenan Way
- 1404 Beringer Ct
- 1372 Keenan Way
- 1368 Keenan Way
- 2022 Wente Place
- 1366 Keenan Way
- 1376 Keenan Way
- 1359 Keenan Way
- 2024 Wente Place