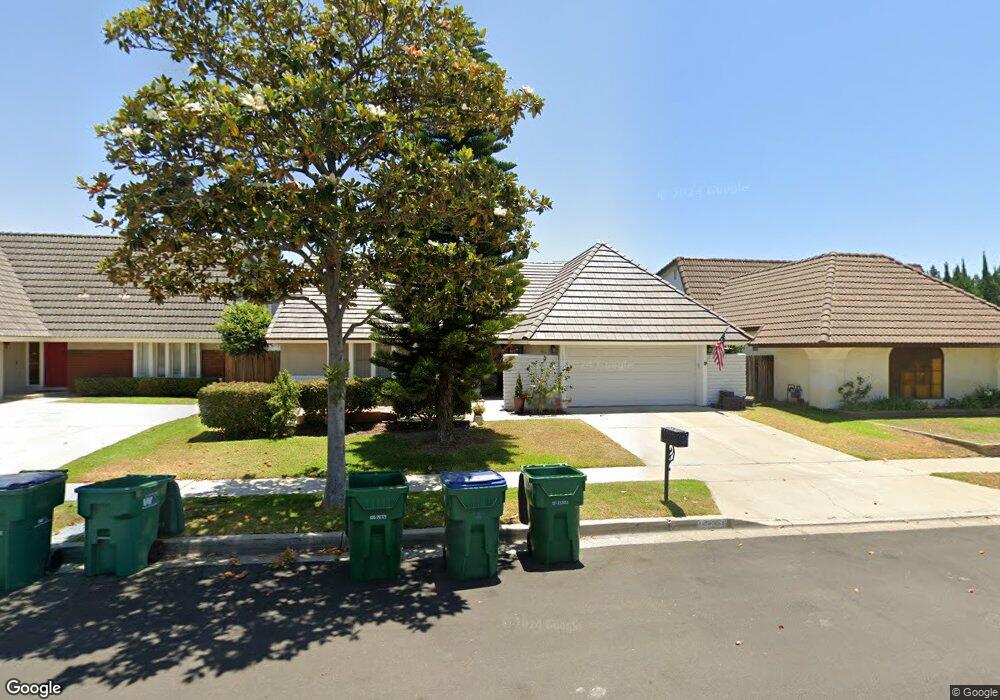
13712 Typee Way Irvine, CA 92620
Northwood NeighborhoodEstimated Value: $1,412,014 - $1,836,000
3
Beds
2
Baths
1,654
Sq Ft
$962/Sq Ft
Est. Value
About This Home
This home is located at 13712 Typee Way, Irvine, CA 92620 and is currently estimated at $1,591,254, approximately $962 per square foot. 13712 Typee Way is a home located in Orange County with nearby schools including Brywood Elementary School, Sierra Vista Middle School, and Northwood High School.
Ownership History
Date
Name
Owned For
Owner Type
Purchase Details
Closed on
May 7, 2019
Sold by
Batchelor Sandra M
Bought by
Batchelor Turner Andrew Dean and Batchelor Turner Sandra
Current Estimated Value
Purchase Details
Closed on
Mar 14, 2017
Sold by
Batchelor Sandra M
Bought by
Batchelor Sandra M and Sandra M Batchelor Revocable Trust
Purchase Details
Closed on
Feb 10, 2017
Sold by
Batchelor John David
Bought by
Batchelor Sandra M
Purchase Details
Closed on
Jun 17, 2005
Sold by
Batchelor John D and Batchelor Sandra M
Bought by
Batchelor John David and Batchelor Sandra M P
Purchase Details
Closed on
Mar 28, 1997
Sold by
Cook James M and Cook Margaret B
Bought by
Batchelor John D and Batchelor Sandra M
Home Financials for this Owner
Home Financials are based on the most recent Mortgage that was taken out on this home.
Original Mortgage
$214,600
Outstanding Balance
$27,673
Interest Rate
7.86%
Estimated Equity
$1,563,581
Create a Home Valuation Report for This Property
The Home Valuation Report is an in-depth analysis detailing your home's value as well as a comparison with similar homes in the area
Home Values in the Area
Average Home Value in this Area
Purchase History
| Date | Buyer | Sale Price | Title Company |
|---|---|---|---|
| Batchelor Turner Andrew Dean | -- | None Available | |
| Batchelor Sandra M | -- | None Available | |
| Batchelor Sandra M | -- | None Available | |
| Batchelor John David | -- | -- | |
| Batchelor John D | $282,500 | First American Title Ins Co |
Source: Public Records
Mortgage History
| Date | Status | Borrower | Loan Amount |
|---|---|---|---|
| Open | Batchelor John D | $214,600 |
Source: Public Records
Tax History
| Year | Tax Paid | Tax Assessment Tax Assessment Total Assessment is a certain percentage of the fair market value that is determined by local assessors to be the total taxable value of land and additions on the property. | Land | Improvement |
|---|---|---|---|---|
| 2025 | $4,890 | $460,099 | $317,609 | $142,490 |
| 2024 | $4,890 | $451,078 | $311,381 | $139,697 |
| 2023 | $4,763 | $442,234 | $305,276 | $136,958 |
| 2022 | $4,669 | $433,563 | $299,290 | $134,273 |
| 2021 | $4,561 | $425,062 | $293,421 | $131,641 |
| 2020 | $4,536 | $420,704 | $290,412 | $130,292 |
| 2019 | $4,435 | $412,455 | $284,717 | $127,738 |
| 2018 | $4,356 | $404,368 | $279,134 | $125,234 |
| 2017 | $4,266 | $396,440 | $273,661 | $122,779 |
| 2016 | $4,080 | $388,667 | $268,295 | $120,372 |
| 2015 | $4,020 | $382,829 | $264,265 | $118,564 |
| 2014 | $3,943 | $375,330 | $259,088 | $116,242 |
Source: Public Records
Map
Nearby Homes
- 13702 Typee Way
- 13722 Typee Way
- 13711 Onkayha Cir
- 13701 Onkayha Cir
- 13721 Onkayha Cir
- 13732 Typee Way
- 13692 Typee Way
- 13731 Onkayha Cir
- 13691 Onkayha Cir
- 13711 Typee Way
- 13721 Typee Way
- 13682 Typee Way
- 13742 Typee Way
- 13691 Typee Way
- 13731 Typee Way
- 13681 Onkayha Cir
- 13741 Onkayha Cir
- 13756 Typee Way
- 13672 Typee Way
- 13741 Typee Way
Your Personal Tour Guide
Ask me questions while you tour the home.