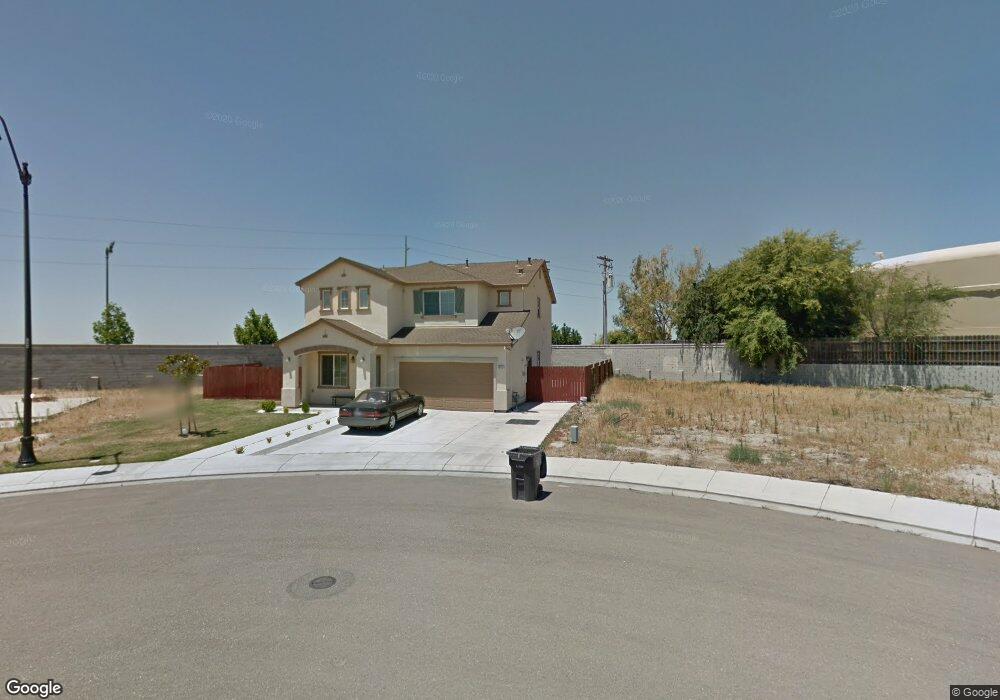
13713 Bloom Way Lathrop, CA 95330
East Lathrop NeighborhoodEstimated Value: $619,141 - $698,000
4
Beds
3
Baths
2,318
Sq Ft
$286/Sq Ft
Est. Value
About This Home
This home is located at 13713 Bloom Way, Lathrop, CA 95330 and is currently estimated at $663,785, approximately $286 per square foot. 13713 Bloom Way is a home located in San Joaquin County with nearby schools including Joseph Widmer, Jr. Elementary School, Lathrop High School, and Central Valley Christian Academy.
Ownership History
Date
Name
Owned For
Owner Type
Purchase Details
Closed on
Jun 11, 2013
Sold by
Kaur Baljit
Bought by
Singh Harpal
Current Estimated Value
Home Financials for this Owner
Home Financials are based on the most recent Mortgage that was taken out on this home.
Original Mortgage
$145,000
Outstanding Balance
$102,638
Interest Rate
3.38%
Mortgage Type
New Conventional
Estimated Equity
$561,147
Purchase Details
Closed on
Jan 24, 2011
Sold by
Kaur Baljit
Bought by
Singh Harpal
Home Financials for this Owner
Home Financials are based on the most recent Mortgage that was taken out on this home.
Original Mortgage
$150,200
Interest Rate
4.82%
Mortgage Type
New Conventional
Purchase Details
Closed on
Mar 7, 2008
Sold by
Lathrop Park Llc
Bought by
Olson Timothy A and Olson Debra L
Home Financials for this Owner
Home Financials are based on the most recent Mortgage that was taken out on this home.
Original Mortgage
$360,168
Interest Rate
5.72%
Mortgage Type
Purchase Money Mortgage
Create a Home Valuation Report for This Property
The Home Valuation Report is an in-depth analysis detailing your home's value as well as a comparison with similar homes in the area
Home Values in the Area
Average Home Value in this Area
Purchase History
| Date | Buyer | Sale Price | Title Company |
|---|---|---|---|
| Singh Harpal | -- | First American Title Company | |
| Singh Harpal | -- | Old Republic Title Company | |
| Singh Harpal | $188,000 | Old Republic Title Company | |
| Olson Timothy A | $424,000 | None Available |
Source: Public Records
Mortgage History
| Date | Status | Borrower | Loan Amount |
|---|---|---|---|
| Open | Singh Harpal | $145,000 | |
| Closed | Singh Harpal | $150,200 | |
| Previous Owner | Olson Timothy A | $360,168 |
Source: Public Records
Tax History
| Year | Tax Paid | Tax Assessment Tax Assessment Total Assessment is a certain percentage of the fair market value that is determined by local assessors to be the total taxable value of land and additions on the property. | Land | Improvement |
|---|---|---|---|---|
| 2025 | $4,177 | $276,041 | $58,928 | $217,113 |
| 2024 | $4,155 | $270,629 | $57,773 | $212,856 |
| 2023 | $4,026 | $265,324 | $56,641 | $208,683 |
| 2022 | $3,978 | $260,123 | $55,531 | $204,592 |
| 2021 | $3,942 | $255,024 | $54,443 | $200,581 |
| 2020 | $3,825 | $252,410 | $53,885 | $198,525 |
| 2019 | $3,786 | $247,462 | $52,829 | $194,633 |
| 2018 | $3,746 | $242,611 | $51,794 | $190,817 |
| 2017 | $3,784 | $237,855 | $50,779 | $187,076 |
| 2016 | $3,386 | $203,193 | $49,784 | $153,409 |
| 2014 | $3,064 | $196,222 | $48,076 | $148,146 |
Source: Public Records
Map
Nearby Homes
- 174 Castlewood Ave
- 14129 Reverend Maurice Cotton Dr
- 14310 Cedar Valley Dr
- 795 Saint Andrew St
- 774 Sugar Pine Dr
- 827 Saint Andrew St
- 127 Argillite Ave
- 808 Prairie Dunes Dr
- 292 W Lathrop Rd
- 13410 Brookwood Way
- 272 Olivine Ave
- 960 Kirkwood Way
- 15150 Hollyhock Ct
- 467 Calcite Ave
- 710 Sunflower Dr
- 15820 S Harlan Rd Unit 16
- 15820 S Harlan Rd Unit 98
- 15940 Warfield Rd
- 16012 Julie Ln
- 15810 Mckinley Ave
- 115 Fleurette Ln
- 13715 Bloom Way
- 119 Fleurette Ln
- 13717 Bloom Way
- 124 Fleurette Ln
- 123 Fleurette Ln
- 13719 Bloom Way
- 128 Fleurette Ln
- 101 Warren Ave
- 127 Fleurette Ln
- 130 Fleurette Ln
- 109 Warren Ave
- 150 Shadywood Ave
- 131 Fleurette Ln
- 117 Warren Ave
- 134 Fleurette Ln
- 13709 Tracywood St
- 154 Shadywood Ave
- 135 Fleurette Ln
- 121 Warren Ave
Your Personal Tour Guide
Ask me questions while you tour the home.