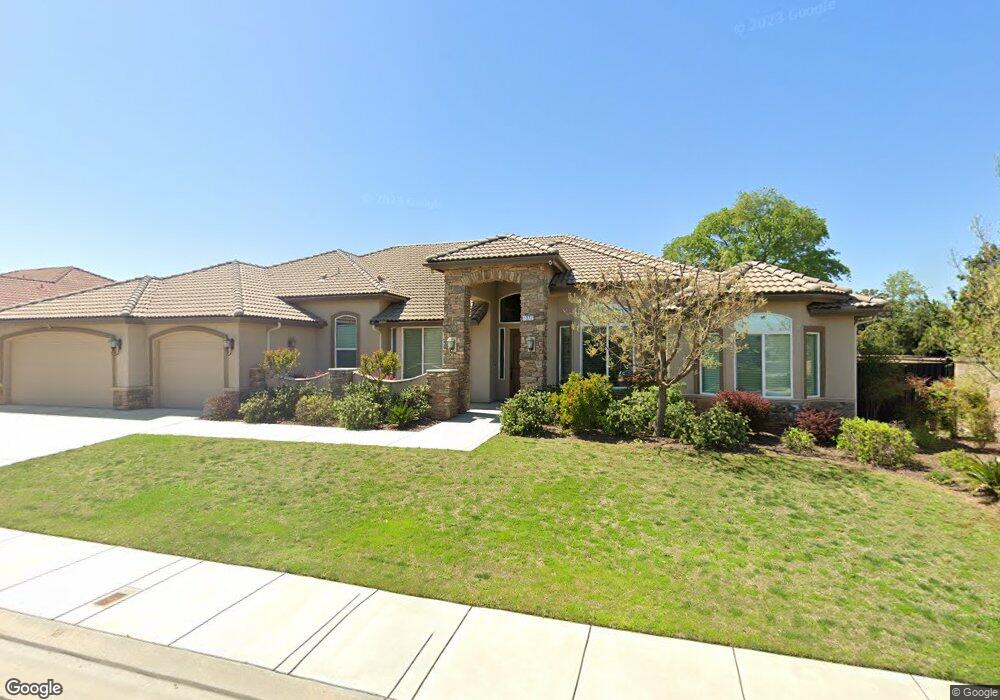
1372 Hanson Ave Clovis, CA 93619
Estimated Value: $869,902 - $1,053,000
3
Beds
3
Baths
3,716
Sq Ft
$260/Sq Ft
Est. Value
About This Home
This home is located at 1372 Hanson Ave, Clovis, CA 93619 and is currently estimated at $966,967, approximately $260 per square foot. 1372 Hanson Ave is a home with nearby schools including Dry Creek Elementary School, Alta Sierra Intermediate School, and Buchanan High School.
Ownership History
Date
Name
Owned For
Owner Type
Purchase Details
Closed on
Oct 2, 2020
Sold by
Shanker Gyan and Shanker Vandana
Bought by
Shanker Gyan and Shanker Vandana
Current Estimated Value
Purchase Details
Closed on
Jun 25, 2020
Sold by
Shanker Gyan and Shanker Vandana
Bought by
Shanker Gyan and Shanker Vandana
Home Financials for this Owner
Home Financials are based on the most recent Mortgage that was taken out on this home.
Original Mortgage
$395,000
Outstanding Balance
$349,603
Interest Rate
3%
Mortgage Type
New Conventional
Estimated Equity
$617,364
Purchase Details
Closed on
Dec 7, 2016
Sold by
Shanker Gyan and Shanker Vandana
Bought by
Shanker Gyan and Shanker Vandana
Purchase Details
Closed on
Sep 30, 2013
Sold by
Me 25
Bought by
Shanker Gyan and Shanker Vandana
Home Financials for this Owner
Home Financials are based on the most recent Mortgage that was taken out on this home.
Original Mortgage
$417,000
Interest Rate
3.62%
Mortgage Type
Adjustable Rate Mortgage/ARM
Create a Home Valuation Report for This Property
The Home Valuation Report is an in-depth analysis detailing your home's value as well as a comparison with similar homes in the area
Home Values in the Area
Average Home Value in this Area
Purchase History
| Date | Buyer | Sale Price | Title Company |
|---|---|---|---|
| Shanker Gyan | -- | None Available | |
| Shanker Gyan | -- | Solidifi Title Company Of Ca | |
| Shanker Gyan | -- | None Available | |
| Shanker Gyan | $541,000 | First American Title Company |
Source: Public Records
Mortgage History
| Date | Status | Borrower | Loan Amount |
|---|---|---|---|
| Open | Shanker Gyan | $395,000 | |
| Previous Owner | Shanker Gyan | $417,000 |
Source: Public Records
Tax History
| Year | Tax Paid | Tax Assessment Tax Assessment Total Assessment is a certain percentage of the fair market value that is determined by local assessors to be the total taxable value of land and additions on the property. | Land | Improvement |
|---|---|---|---|---|
| 2025 | $8,147 | $649,590 | $150,226 | $499,364 |
| 2023 | $7,817 | $624,368 | $144,394 | $479,974 |
| 2022 | $7,707 | $612,126 | $141,563 | $470,563 |
| 2021 | $7,474 | $600,125 | $138,788 | $461,337 |
| 2020 | $7,441 | $593,972 | $137,365 | $456,607 |
| 2019 | $7,299 | $582,326 | $134,672 | $447,654 |
| 2018 | $7,147 | $570,909 | $132,032 | $438,877 |
| 2017 | $7,018 | $559,716 | $129,444 | $430,272 |
| 2016 | $6,550 | $548,742 | $126,906 | $421,836 |
| 2015 | $6,438 | $540,500 | $125,000 | $415,500 |
| 2014 | $1,028 | $76,453 | $76,453 | $0 |
Source: Public Records
Map
Nearby Homes
- 2643 Quincy Ave
- 2670 Muncie Ave
- 2770 Muncie Ave
- 1734 N Park Ave
- 1731 N Hanson Ave
- 2936 Trenton Ave
- 3091 Teague Ave
- 2966 Trenton Ave
- 1617 N Megan Ave
- 2944 Vermont Ave
- 2997 Trenton Ave
- 3088 Teague Ave
- 2361 Cromwell Ave
- 1345 N Kaweah Ave
- 1719 N Whitmore Ave
- 1565 N Kaweah Ave
- 971 N Filbert Ave
- 2319 Prescott Ave
- 3205 Lexington Ave
- 1914 N Greenfield Ave
- 1362 Hanson Ave
- 2624 Portland Ave
- 1342 Hanson Ave
- 1432 N Hanson Ave
- 2627 Omaha Ave
- 2629 Portland Ave
- 1332 N Hanson Ave
- 2634 Portland Ave
- 1452 N Hanson Ave
- 2637 Omaha Ave
- 2639 Portland Ave
- 2626 Omaha Ave
- 2628 Quincy Ave
- 2654 Portland Ave
- 2657 Omaha Ave
- 1472 N Hanson Ave
- 2636 Omaha Ave
- 2659 Portland Ave
- 2638 Quincy Ave
- 2621 Muncie Ave
Your Personal Tour Guide
Ask me questions while you tour the home.