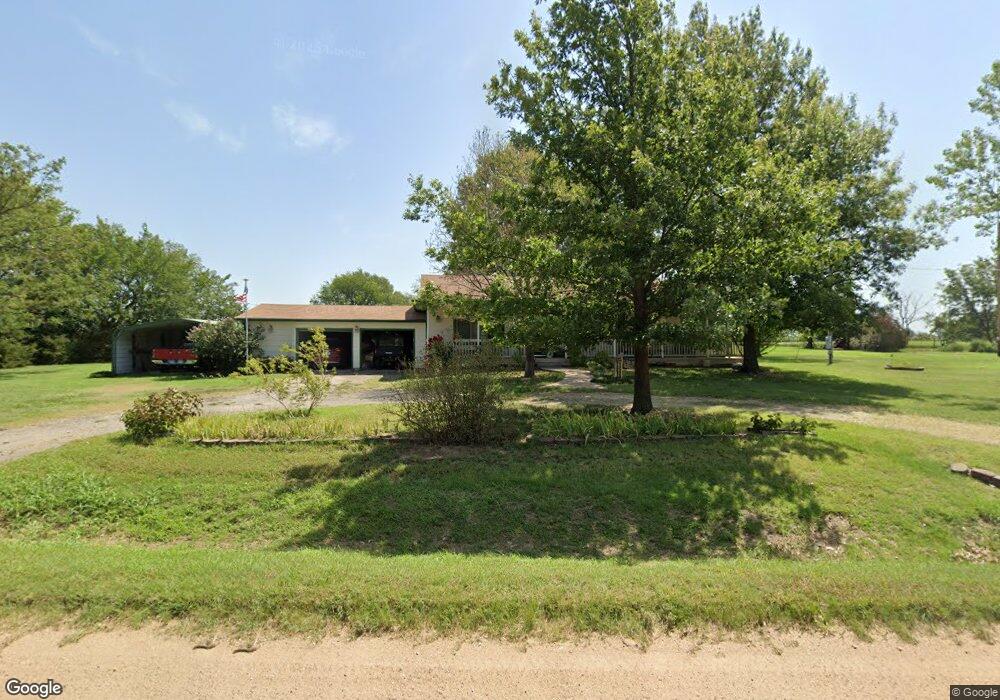
1372 N Greenwich Rd Mulvane, KS 67110
Estimated Value: $309,000 - $396,000
3
Beds
3
Baths
1,600
Sq Ft
$228/Sq Ft
Est. Value
About This Home
This home is located at 1372 N Greenwich Rd, Mulvane, KS 67110 and is currently estimated at $364,613, approximately $227 per square foot. 1372 N Greenwich Rd is a home located in Sumner County with nearby schools including Munson Primary School, Mulvane Grade School, and Mulvane Middle School.
Ownership History
Date
Name
Owned For
Owner Type
Purchase Details
Closed on
Oct 14, 2020
Bought by
Reddick J Tony & Sandra S & Fam Tr
Current Estimated Value
Purchase Details
Closed on
May 28, 2013
Sold by
Reddick James and Reddick Sandra S
Bought by
Reddick James and Reddick Sandra S
Home Financials for this Owner
Home Financials are based on the most recent Mortgage that was taken out on this home.
Original Mortgage
$113,425
Interest Rate
3.38%
Mortgage Type
New Conventional
Purchase Details
Closed on
Mar 11, 2010
Sold by
Reddick James and Reddick Sandra S
Bought by
Reddick James and Reddick Sandra S
Home Financials for this Owner
Home Financials are based on the most recent Mortgage that was taken out on this home.
Original Mortgage
$98,775
Interest Rate
4.97%
Purchase Details
Closed on
Aug 1, 2008
Sold by
Reddick James Tony and Reddick Sandra Sue
Bought by
Reddick J Tony and Reddick Sandra S
Create a Home Valuation Report for This Property
The Home Valuation Report is an in-depth analysis detailing your home's value as well as a comparison with similar homes in the area
Purchase History
We collect this data history from publicly available records. To have your information removed, we recommend requesting removal directly through your county’s website.
| Date | Buyer | Sale Price | Title Company |
|---|---|---|---|
| Reddick J Tony & Sandra S & Fam Tr | -- | -- | |
| Reddick James | -- | -- | |
| Reddick James | -- | -- | |
| Reddick James | -- | -- | |
| Reddick James | -- | -- | |
| Reddick J Tony | -- | -- |
Source: Public Records
Mortgage History
We collect this data history from publicly available records. To have your information removed, we recommend requesting removal directly through your county’s website.
| Date | Status | Borrower | Loan Amount |
|---|---|---|---|
| Previous Owner | Reddick James | $113,425 | |
| Previous Owner | Reddick J Tony | $89,675 | |
| Previous Owner | Reddick J Tony | $98,775 | |
| Previous Owner | Reddick J Tony | $62,000 |
Source: Public Records
Tax History
| Year | Tax Paid | Tax Assessment Tax Assessment Total Assessment is a certain percentage of the fair market value that is determined by local assessors to be the total taxable value of land and additions on the property. | Land | Improvement |
|---|---|---|---|---|
| 2025 | $4,987 | $37,668 | $6,705 | $30,963 |
| 2024 | $4,987 | $36,571 | $6,705 | $29,866 |
| 2023 | $4,651 | $34,178 | $5,322 | $28,856 |
| 2022 | $3,918 | $28,083 | $3,269 | $24,814 |
| 2021 | $3,634 | $26,251 | $3,064 | $23,187 |
| 2020 | $3,434 | $25,001 | $2,844 | $22,157 |
| 2019 | $3,429 | $24,175 | $2,514 | $21,661 |
| 2018 | $3,066 | $22,964 | $2,401 | $20,563 |
| 2017 | $2,794 | $20,395 | $2,401 | $17,994 |
| 2016 | $2,723 | $20,396 | $1,861 | $18,535 |
| 2015 | -- | $20,396 | $1,668 | $18,728 |
| 2014 | -- | $19,511 | $1,461 | $18,050 |
Source: Public Records
Map
Nearby Homes
- 1632 E 140th Ave N
- 1370 N River Rd
- 401 N Trail Drive Cir
- 628 E Main St
- 1677 E 120th Ave N
- 428 E Bridge St
- 5.09 Acres E 111th St S
- 418 E Bridge St
- 425 E Blair St
- 703 Heidi Ln
- 945 N Cedar Brook Cir
- 742 E Brent Dr
- 1602 N Topaz Ln
- 932 N Cedar Brook Cir
- 203 W Bridge St
- 922 E Jade Ct
- 930 E Jade Ct
- 926 E Jade Ct
- 919 E Jade Ct
- 911 E Jade Ct
- 1376 N Greenwich Rd
- 1370 N Greenwich Rd
- 1362 N Greenwich Rd
- 1380 State Road 15
- 1381 N Lightning Bug Knolls
- 1384 N Lightning Bug Knolls
- 1385 N Lightning Bug Knolls
- 1392 N Greenwich Rd
- 1395 State Road 15
- 1362 E Grey Rd
- 1609 E 140th Ave N
- 1406 State Road 15
- 1619 E 140th Ave N
- 1610 E 140th Ave N
- 1350 N Greenwich Rd
- 1604 E 140th Ave N
- 1364 State Road 15
- 1590 E Deer Trail Dr
- 1593 E Deer Trail Dr
- 1358 E Grey Rd
Your Personal Tour Guide
Ask me questions while you tour the home.