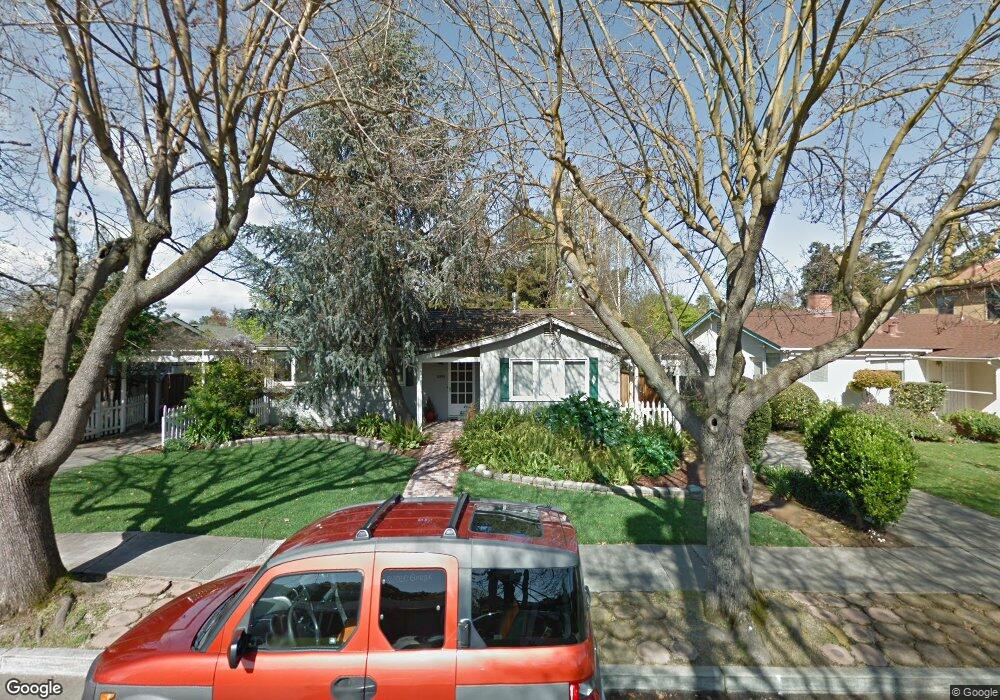
1373 Spencer Ave San Jose, CA 95125
Willow Glen NeighborhoodEstimated Value: $1,622,176 - $2,043,000
3
Beds
2
Baths
1,680
Sq Ft
$1,054/Sq Ft
Est. Value
About This Home
This home is located at 1373 Spencer Ave, San Jose, CA 95125 and is currently estimated at $1,771,294, approximately $1,054 per square foot. 1373 Spencer Ave is a home located in Santa Clara County with nearby schools including Willow Glen Elementary, Willow Glen Middle, and Willow Glen High School.
Ownership History
Date
Name
Owned For
Owner Type
Purchase Details
Closed on
Jun 18, 2021
Sold by
Cheney Thomas Clayton and Cheney Nancy Jean
Bought by
Cheney Thomas Clayton and Cheney Nancy Jean
Current Estimated Value
Purchase Details
Closed on
Nov 10, 1995
Sold by
Halliday David K
Bought by
Halliday Betty Louise
Home Financials for this Owner
Home Financials are based on the most recent Mortgage that was taken out on this home.
Original Mortgage
$222,000
Outstanding Balance
$3,111
Interest Rate
7.62%
Estimated Equity
$1,768,183
Purchase Details
Closed on
Nov 2, 1995
Sold by
Halliday Betty Louise
Bought by
Cheney Tom and Cheney Nancy
Home Financials for this Owner
Home Financials are based on the most recent Mortgage that was taken out on this home.
Original Mortgage
$222,000
Outstanding Balance
$3,111
Interest Rate
7.62%
Estimated Equity
$1,768,183
Purchase Details
Closed on
Mar 29, 1995
Sold by
Halliday Betty Louise
Bought by
Halliday Betty Louise
Purchase Details
Closed on
Dec 9, 1994
Sold by
Brookmeyer Edith E and Brookmeyer William R
Bought by
Brookmeyer Edith E
Create a Home Valuation Report for This Property
The Home Valuation Report is an in-depth analysis detailing your home's value as well as a comparison with similar homes in the area
Home Values in the Area
Average Home Value in this Area
Purchase History
| Date | Buyer | Sale Price | Title Company |
|---|---|---|---|
| Cheney Thomas Clayton | -- | None Available | |
| Halliday Betty Louise | -- | North American Title Co | |
| Cheney Tom | $277,500 | North American Title Co | |
| Halliday Betty Louise | -- | -- | |
| Brookmeyer Edith E | -- | Chicago Title Company |
Source: Public Records
Mortgage History
| Date | Status | Borrower | Loan Amount |
|---|---|---|---|
| Open | Cheney Tom | $222,000 | |
| Closed | Cheney Tom | $27,750 |
Source: Public Records
Tax History Compared to Growth
Tax History
| Year | Tax Paid | Tax Assessment Tax Assessment Total Assessment is a certain percentage of the fair market value that is determined by local assessors to be the total taxable value of land and additions on the property. | Land | Improvement |
|---|---|---|---|---|
| 2025 | $7,161 | $495,391 | $322,274 | $173,117 |
| 2024 | $7,161 | $485,678 | $315,955 | $169,723 |
| 2023 | $7,002 | $476,156 | $309,760 | $166,396 |
| 2022 | $6,942 | $466,821 | $303,687 | $163,134 |
| 2021 | $6,687 | $457,669 | $297,733 | $159,936 |
| 2020 | $6,510 | $452,978 | $294,681 | $158,297 |
| 2019 | $6,356 | $444,097 | $288,903 | $155,194 |
| 2018 | $6,279 | $435,390 | $283,239 | $152,151 |
| 2017 | $6,219 | $426,854 | $277,686 | $149,168 |
| 2016 | $6,059 | $418,486 | $272,242 | $146,244 |
| 2015 | $6,009 | $412,201 | $268,153 | $144,048 |
| 2014 | $5,573 | $404,128 | $262,901 | $141,227 |
Source: Public Records
Map
Nearby Homes
- 1326 Milton Way
- 709 Minnesota Ave
- 1206 Clark St
- 1249 Prevost St
- 1427 Alma Loop
- 1124 Delmas Ave
- 1275 Bird Ave
- 501 Minnesota Ave
- 1025 Delmas Ave
- 975 Prevost St
- 986 Spencer Ave
- 1610 Carmel Dr
- 482 Shadowgraph Dr
- 510 Shadowgraph Dr
- 500 Shadowgraph Dr
- 935 Chabrant Way
- 546 Coe Ave
- 1087 Merle Ave
- 1265 Blewett Ave
- 1148 Palm St
- 1383 Spencer Ave
- 1363 Spencer Ave
- 1333 Spencer Ave
- 1393 Spencer Ave
- 1340 Delmas Ave
- 626 Dorothy Ave
- 634 Dorothy Ave
- 614 Dorothy Ave
- 1301 Spencer Ave
- 644 Dorothy Ave
- 1332 Delmas Ave
- 1370 Spencer Ave
- 1358 Spencer Ave
- 654 Dorothy Ave
- 1380 Spencer Ave
- 1346 Spencer Ave
- 604 Dorothy Ave
- 1388 Spencer Ave
- 1334 Spencer Ave
- 664 Dorothy Ave