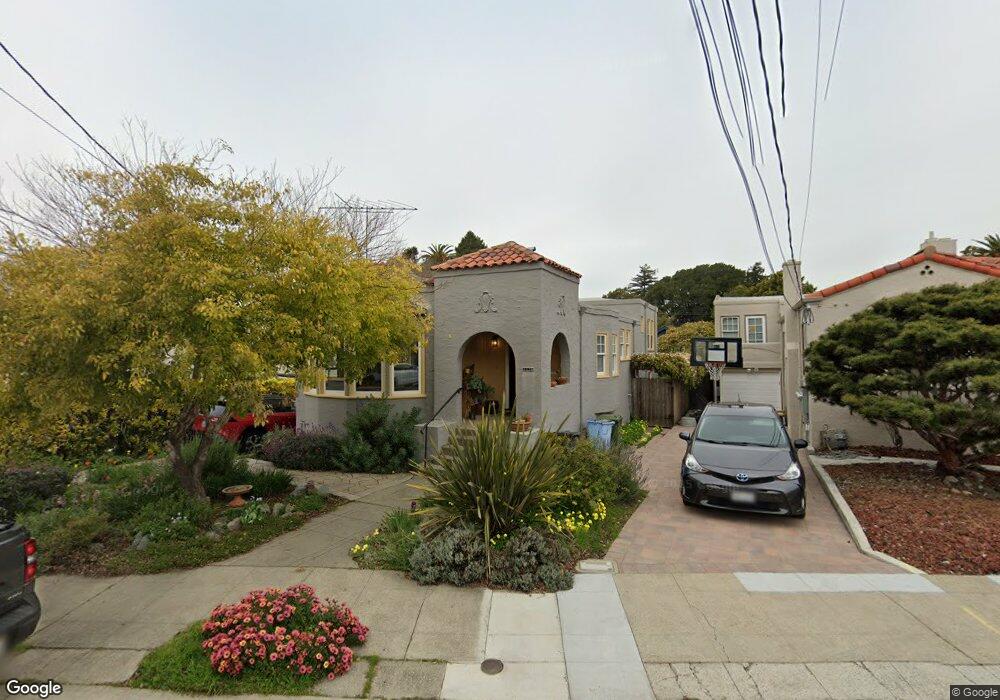
1375 Ada St Berkeley, CA 94702
West Berkeley NeighborhoodEstimated Value: $1,454,000 - $2,092,000
2
Beds
2
Baths
1,657
Sq Ft
$1,000/Sq Ft
Est. Value
About This Home
This home is located at 1375 Ada St, Berkeley, CA 94702 and is currently estimated at $1,657,059, approximately $1,000 per square foot. 1375 Ada St is a home located in Alameda County with nearby schools including Ruth Acty Elementary, Berkeley Arts Magnet at Whittier School, and Thousand Oaks Elementary School.
Ownership History
Date
Name
Owned For
Owner Type
Purchase Details
Closed on
May 11, 2018
Sold by
Jennings Anne G and Stacklin Andrew G
Bought by
Stacklin Andrew G and Jennings Anne G
Current Estimated Value
Purchase Details
Closed on
Aug 11, 1994
Sold by
Mengshol Clarence O
Bought by
Stacklin Andrew G and Jennings Anne G
Home Financials for this Owner
Home Financials are based on the most recent Mortgage that was taken out on this home.
Original Mortgage
$150,000
Interest Rate
8.73%
Create a Home Valuation Report for This Property
The Home Valuation Report is an in-depth analysis detailing your home's value as well as a comparison with similar homes in the area
Home Values in the Area
Average Home Value in this Area
Purchase History
| Date | Buyer | Sale Price | Title Company |
|---|---|---|---|
| Stacklin Andrew G | -- | None Available | |
| Stacklin Andrew G | $265,000 | Fidelity National Title |
Source: Public Records
Mortgage History
| Date | Status | Borrower | Loan Amount |
|---|---|---|---|
| Closed | Stacklin Andrew G | $150,000 |
Source: Public Records
Tax History
| Year | Tax Paid | Tax Assessment Tax Assessment Total Assessment is a certain percentage of the fair market value that is determined by local assessors to be the total taxable value of land and additions on the property. | Land | Improvement |
|---|---|---|---|---|
| 2025 | $9,901 | $494,222 | $133,528 | $367,694 |
| 2024 | $9,901 | $484,396 | $130,911 | $360,485 |
| 2023 | $9,888 | $481,763 | $128,344 | $353,419 |
| 2022 | $8,595 | $433,945 | $125,828 | $315,117 |
| 2021 | $8,589 | $425,300 | $123,361 | $308,939 |
| 2020 | $8,086 | $427,868 | $122,096 | $305,772 |
| 2019 | $7,710 | $419,480 | $119,703 | $299,777 |
| 2018 | $7,547 | $411,256 | $117,356 | $293,900 |
| 2017 | $7,265 | $403,193 | $115,055 | $288,138 |
| 2016 | $6,976 | $395,290 | $112,800 | $282,490 |
| 2015 | $6,633 | $370,353 | $111,106 | $259,247 |
| 2014 | $6,504 | $363,100 | $108,930 | $254,170 |
Source: Public Records
Map
Nearby Homes
- 1368 Rose St
- 1564 Sacramento St
- 1529 Ada St
- 1631 Belvedere Ave
- 1322 Virginia St
- 1509 Francis St
- 1120 Curtis St
- 1127 Key Route Blvd
- 1626 Hopkins St
- 1339 Kains Ave
- 1728 Curtis St
- 1207 Cornell Ave
- 1234 Stannage Ave
- 1411 Hearst Ave Unit 2
- 1813 Sacramento St
- 1261 Hearst Ave
- 1114 Talbot Ave
- 1036 Ramona Ave
- 1213 San Pablo Ave
- 1128 Delaware St
Your Personal Tour Guide
Ask me questions while you tour the home.