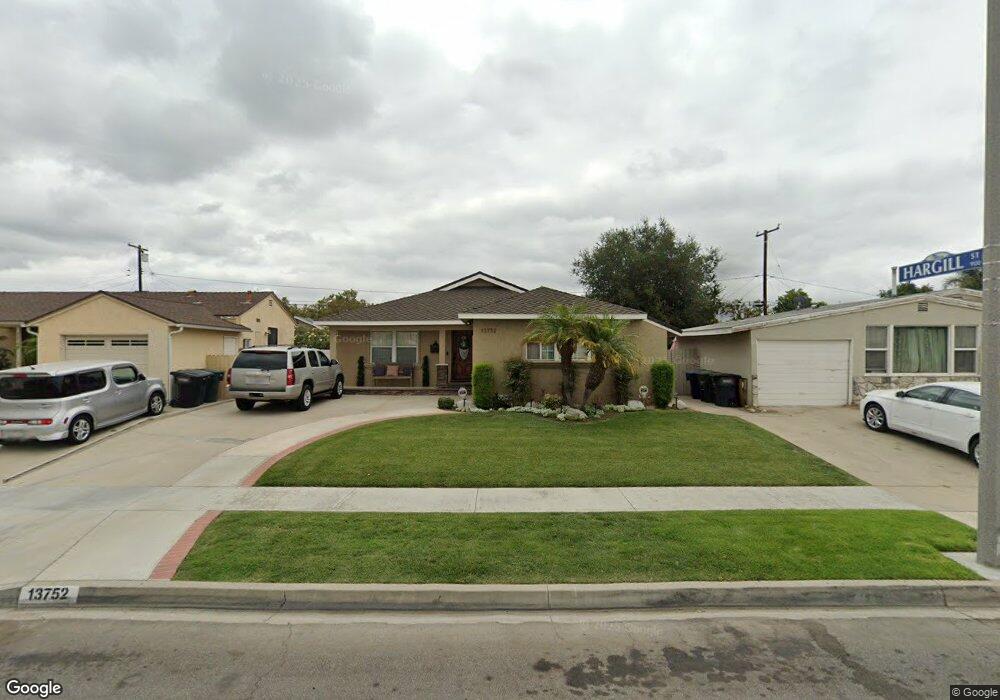
13752 Hanwell Ave Bellflower, CA 90706
Estimated Value: $702,000 - $877,000
3
Beds
2
Baths
1,721
Sq Ft
$466/Sq Ft
Est. Value
About This Home
This home is located at 13752 Hanwell Ave, Bellflower, CA 90706 and is currently estimated at $801,252, approximately $465 per square foot. 13752 Hanwell Ave is a home located in Los Angeles County with nearby schools including Lewis Elementary School, Sussman Middle School, and Downey High School.
Ownership History
Date
Name
Owned For
Owner Type
Purchase Details
Closed on
May 17, 1999
Sold by
Walsten Donald G
Bought by
Frausto Rolando and Frausto Yolanda
Current Estimated Value
Home Financials for this Owner
Home Financials are based on the most recent Mortgage that was taken out on this home.
Original Mortgage
$151,240
Outstanding Balance
$38,981
Interest Rate
7.01%
Mortgage Type
FHA
Estimated Equity
$762,271
Purchase Details
Closed on
May 3, 1999
Sold by
Walters Michelle
Bought by
Walters Joseph Earl
Home Financials for this Owner
Home Financials are based on the most recent Mortgage that was taken out on this home.
Original Mortgage
$151,240
Outstanding Balance
$38,981
Interest Rate
7.01%
Mortgage Type
FHA
Estimated Equity
$762,271
Purchase Details
Closed on
Aug 6, 1996
Sold by
Walsten Donald Gerard
Bought by
Walsten Donald Gerard and Walters Joseph Earl
Create a Home Valuation Report for This Property
The Home Valuation Report is an in-depth analysis detailing your home's value as well as a comparison with similar homes in the area
Home Values in the Area
Average Home Value in this Area
Purchase History
| Date | Buyer | Sale Price | Title Company |
|---|---|---|---|
| Frausto Rolando | $153,000 | North American Title Co | |
| Walters Joseph Earl | -- | North American Title Co | |
| Walsten Donald Gerard | -- | -- |
Source: Public Records
Mortgage History
| Date | Status | Borrower | Loan Amount |
|---|---|---|---|
| Open | Frausto Rolando | $151,240 |
Source: Public Records
Tax History Compared to Growth
Tax History
| Year | Tax Paid | Tax Assessment Tax Assessment Total Assessment is a certain percentage of the fair market value that is determined by local assessors to be the total taxable value of land and additions on the property. | Land | Improvement |
|---|---|---|---|---|
| 2025 | $4,105 | $305,245 | $163,340 | $141,905 |
| 2024 | $4,105 | $299,261 | $160,138 | $139,123 |
| 2023 | $3,972 | $293,395 | $156,999 | $136,396 |
| 2022 | $3,782 | $287,643 | $153,921 | $133,722 |
| 2021 | $3,707 | $282,003 | $150,903 | $131,100 |
| 2019 | $3,613 | $273,640 | $146,428 | $127,212 |
| 2018 | $3,457 | $268,275 | $143,557 | $124,718 |
| 2016 | $3,336 | $257,860 | $137,984 | $119,876 |
| 2015 | $3,289 | $253,988 | $135,912 | $118,076 |
| 2014 | $3,118 | $249,014 | $133,250 | $115,764 |
Source: Public Records
Map
Nearby Homes
- 9130 Hargill St
- 13742 Hanwell Ave
- 13440 Lakewood Blvd Unit 97
- 13440 Lakewood Blvd Unit 98
- 13440 Lakewood Blvd Unit 99
- 9226 Foster Rd
- 13331 Blvd
- 9244 Gardendale St
- 9225 Rosecrans Ave
- 12707 Glenshire Rd
- 8554 Elburg St Unit C
- 9229 Mandale St
- 9494 Van Ruiten St
- 12843 Columbia Way
- 9564 Rosecrans Ave
- 8600 Contreras St Unit 68
- 8600 Contreras St Unit 27
- 8314 Somerset Ranch Rd Unit D
- 13522 Ardis Ave
- 8502 Comolette St
- 13746 Hanwell Ave
- 13758 Hanwell Ave
- 13802 Hanwell Ave
- 13809 Birkhall Ave
- 13813 Birkhall Ave
- 13803 Birkhall Ave
- 13738 Hanwell Ave
- 13808 Hanwell Ave
- 13817 Birkhall Ave
- 13739 Birkhall Ave
- 13753 Hanwell Ave
- 13745 Hanwell Ave
- 13805 Hanwell Ave
- 13732 Hanwell Ave
- 13812 Hanwell Ave
- 13823 Birkhall Ave
- 13735 Birkhall Ave
- 13739 Hanwell Ave
- 13811 Hanwell Ave
- 13726 Hanwell Ave