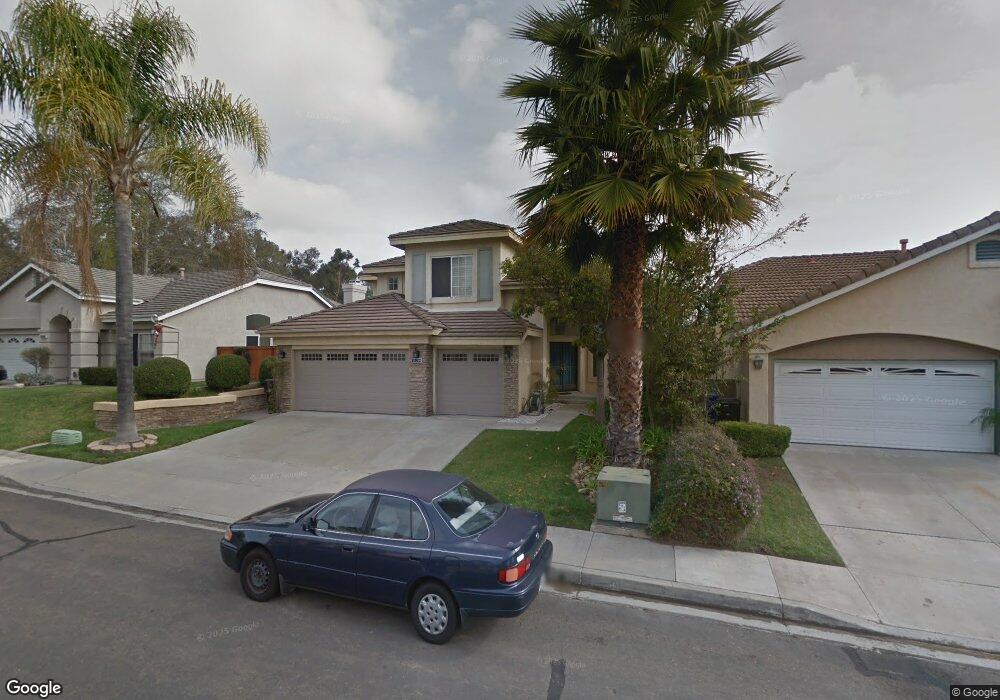
13769 Esprit Ave San Diego, CA 92128
Carmel Mountain NeighborhoodEstimated Value: $1,273,033 - $1,534,000
4
Beds
3
Baths
2,079
Sq Ft
$687/Sq Ft
Est. Value
About This Home
This home is located at 13769 Esprit Ave, San Diego, CA 92128 and is currently estimated at $1,427,258, approximately $686 per square foot. 13769 Esprit Ave is a home located in San Diego County with nearby schools including Shoal Creek Elementary School, Meadowbrook Middle, and Rancho Bernardo High.
Ownership History
Date
Name
Owned For
Owner Type
Purchase Details
Closed on
Aug 22, 2016
Sold by
Gallant Craig J
Bought by
Gallant Kyungsoon
Current Estimated Value
Purchase Details
Closed on
Nov 27, 2009
Sold by
Gallant Craig J and Gallant Kyungsoon
Bought by
Gallant Craig J and Gallant Kyungsoon
Purchase Details
Closed on
Aug 28, 1997
Sold by
Lomeli Paul A and Lomeli Kellie M
Bought by
Gallant Craig J and Gallant Kyungsoon
Home Financials for this Owner
Home Financials are based on the most recent Mortgage that was taken out on this home.
Original Mortgage
$185,000
Interest Rate
7.34%
Mortgage Type
Balloon
Purchase Details
Closed on
Apr 15, 1996
Sold by
Farrell Seann
Bought by
Lomeli Paul A and Lomeli Kellie M
Home Financials for this Owner
Home Financials are based on the most recent Mortgage that was taken out on this home.
Original Mortgage
$234,000
Interest Rate
7.62%
Purchase Details
Closed on
Mar 31, 1992
Create a Home Valuation Report for This Property
The Home Valuation Report is an in-depth analysis detailing your home's value as well as a comparison with similar homes in the area
Home Values in the Area
Average Home Value in this Area
Purchase History
| Date | Buyer | Sale Price | Title Company |
|---|---|---|---|
| Gallant Kyungsoon | -- | None Available | |
| Gallant Craig J | -- | None Available | |
| Gallant Craig J | $260,000 | Fidelity National Title | |
| Lomeli Paul A | -- | Fidelity National Title | |
| Lomeli Paul A | $260,000 | American Title Ins Co | |
| -- | $250,800 | -- |
Source: Public Records
Mortgage History
| Date | Status | Borrower | Loan Amount |
|---|---|---|---|
| Closed | Gallant Craig J | $185,000 | |
| Previous Owner | Lomeli Paul A | $234,000 |
Source: Public Records
Tax History Compared to Growth
Tax History
| Year | Tax Paid | Tax Assessment Tax Assessment Total Assessment is a certain percentage of the fair market value that is determined by local assessors to be the total taxable value of land and additions on the property. | Land | Improvement |
|---|---|---|---|---|
| 2025 | $4,320 | $415,134 | $191,600 | $223,534 |
| 2024 | $4,320 | $406,995 | $187,844 | $219,151 |
| 2023 | $4,226 | $399,015 | $184,161 | $214,854 |
| 2022 | $4,160 | $391,192 | $180,550 | $210,642 |
| 2021 | $4,081 | $383,522 | $177,010 | $206,512 |
| 2020 | $4,037 | $379,590 | $175,195 | $204,395 |
| 2019 | $3,934 | $372,148 | $171,760 | $200,388 |
| 2018 | $3,822 | $364,852 | $168,393 | $196,459 |
| 2017 | $81 | $357,699 | $165,092 | $192,607 |
| 2016 | $4,446 | $350,686 | $161,855 | $188,831 |
| 2015 | $4,390 | $345,419 | $159,424 | $185,995 |
| 2014 | $4,355 | $338,654 | $156,302 | $182,352 |
Source: Public Records
Map
Nearby Homes
- 12216 Holland Rd
- 13737 Esprit Ave
- 12194 Wilsey Way
- 12311 Witt Rd
- 12224 Mulholland Ct
- 12047 Tivoli Park Row Unit 3
- 12127 Corte Napoli
- 13703 Tradition St
- 13599 Tradition St
- 11986 Tivoli Park Row
- 14106 Brent Wilsey Place Unit 3
- 13808 Pomerado Rd
- 14346 Savannah Ct
- 12112 Carter Ln
- 13834 Tobiasson Rd
- 13751 Powers Rd
- 14215 Jonah Way
- 13731 Sorbonne Ct
- 14230 Jonah Way
- Residence 3 Plan at The Trails - Lavender
- 13759 Esprit Ave
- 13779 Esprit Ave
- 13757 Esprit Ave
- 13789 Esprit Ave
- 13778 Esprit Ave Unit 22A
- 13788 Esprit Ave
- 13753 Esprit Ave
- 13768 Esprit Ave Unit 22A
- 13798 Esprit Ave
- 13758 Esprit Ave
- 13797 Esprit Ave Unit 22A
- 13749 Esprit Ave
- 13808 Esprit Ave
- 13744 Esprit Ave
- 13818 Esprit Ave
- 12211 Holland Rd
- 12202 Witt Rd
- 12204 Holland Rd
- 13828 Esprit Ave
- 13727 Esprit Ave