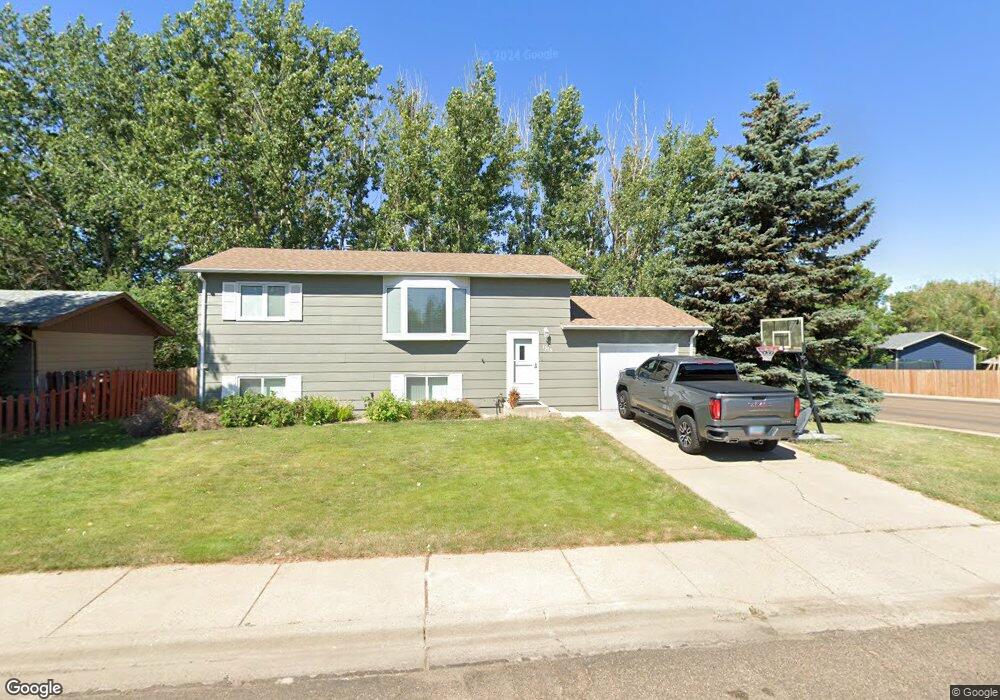
1379 3rd Ave E Dickinson, ND 58601
Estimated Value: $255,138 - $309,000
3
Beds
2
Baths
864
Sq Ft
$318/Sq Ft
Est. Value
About This Home
This home is located at 1379 3rd Ave E, Dickinson, ND 58601 and is currently estimated at $275,035, approximately $318 per square foot. 1379 3rd Ave E is a home located in Stark County with nearby schools including Hope Christian Academy and Trinity Catholic Schools.
Ownership History
Date
Name
Owned For
Owner Type
Purchase Details
Closed on
Jan 22, 2014
Sold by
Hanneman David and Stone Mandy
Bought by
Stone Mandy
Current Estimated Value
Purchase Details
Closed on
Oct 30, 2006
Sold by
Kadrmas Shawn M and Kadrmas Dawn Nicole
Bought by
Hanneman David J and Stone Hanneman Mandy
Home Financials for this Owner
Home Financials are based on the most recent Mortgage that was taken out on this home.
Original Mortgage
$107,650
Interest Rate
6.5%
Mortgage Type
New Conventional
Create a Home Valuation Report for This Property
The Home Valuation Report is an in-depth analysis detailing your home's value as well as a comparison with similar homes in the area
Home Values in the Area
Average Home Value in this Area
Purchase History
| Date | Buyer | Sale Price | Title Company |
|---|---|---|---|
| Stone Mandy | -- | None Available | |
| Hanneman David J | -- | Dickinson Title Co |
Source: Public Records
Mortgage History
| Date | Status | Borrower | Loan Amount |
|---|---|---|---|
| Previous Owner | Hanneman David J | $107,650 |
Source: Public Records
Tax History
| Year | Tax Paid | Tax Assessment Tax Assessment Total Assessment is a certain percentage of the fair market value that is determined by local assessors to be the total taxable value of land and additions on the property. | Land | Improvement |
|---|---|---|---|---|
| 2025 | $725 | $183,400 | $26,700 | $156,700 |
| 2024 | $1,792 | $183,400 | $26,700 | $156,700 |
| 2023 | $1,809 | $183,400 | $26,700 | $156,700 |
| 2022 | $1,717 | $86,300 | $0 | $0 |
| 2021 | $1,679 | $163,200 | $26,700 | $136,500 |
| 2020 | $1,702 | $163,200 | $26,700 | $136,500 |
| 2019 | $1,707 | $163,200 | $26,700 | $136,500 |
| 2017 | $1,652 | $170,000 | $26,700 | $143,300 |
| 2015 | $1,652 | $188,700 | $25,400 | $163,300 |
| 2014 | $1,740 | $184,000 | $25,400 | $158,600 |
| 2013 | -- | $177,700 | $25,400 | $152,300 |
Source: Public Records
Map
Nearby Homes
Your Personal Tour Guide
Ask me questions while you tour the home.