138 E Clay St Colusa, CA 95932
Estimated Value: $265,000 - $351,000
About This Home
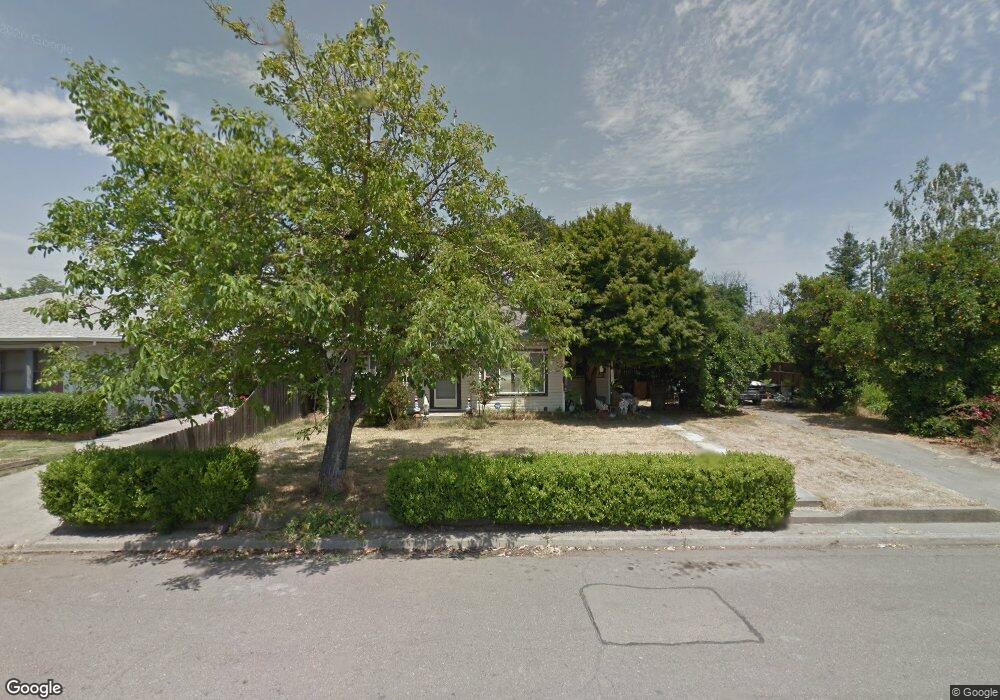
This home is located at 138 E Clay St, Colusa, CA 95932 and is currently estimated at $308,836, approximately $239 per square foot. 138 E Clay St is a home located in Colusa County with nearby schools including James M. Burchfield Primary School, George T. Egling Middle School, and Colusa High School.
Ownership History
We collect this data history from publicly available records. To have your information removed, we recommend requesting removal directly through your county’s website.
Purchase Details
Home Financials for this Owner
Home Financials are based on the most recent Mortgage that was taken out on this home.Home Values in the Area
Average Home Value in this Area
Purchase History
We collect this data history from publicly available records. To have your information removed, we recommend requesting removal directly through your county’s website.
| Date | Buyer | Sale Price | Title Company |
|---|---|---|---|
| -- | Financial Title |
Mortgage History
We collect this data history from publicly available records. To have your information removed, we recommend requesting removal directly through your county’s website.
| Date | Status | Borrower | Loan Amount |
|---|---|---|---|
| Closed | $256,500 |
Tax History
We collect this data history from publicly available records. To have your information removed, we recommend requesting removal directly through your county’s website.
| Year | Tax Paid | Tax Assessment Tax Assessment Total Assessment is a certain percentage of the fair market value that is determined by local assessors to be the total taxable value of land and additions on the property. | Land | Improvement |
|---|---|---|---|---|
| 2025 | $1,295 | $115,246 | $46,095 | $69,151 |
| 2024 | $1,295 | $112,988 | $45,192 | $67,796 |
| 2023 | $1,242 | $110,773 | $44,306 | $66,467 |
| 2022 | $1,241 | $108,602 | $43,438 | $65,164 |
| 2021 | $1,193 | $106,474 | $42,587 | $63,887 |
| 2020 | $1,180 | $105,383 | $42,151 | $63,232 |
| 2019 | $1,149 | $103,318 | $41,325 | $61,993 |
| 2018 | $1,147 | $101,293 | $40,515 | $60,778 |
| 2017 | $1,129 | $99,308 | $39,721 | $59,587 |
| 2016 | $1,114 | $97,362 | $38,943 | $58,419 |
| 2015 | $1,084 | $95,901 | $38,359 | $57,542 |
| 2014 | $1,031 | $94,023 | $37,608 | $56,415 |
Map
- 80 2nd St
- 546 Parkhill St
- 7300 Farinon Rd
- 303 Louis Ln
- 724 Webster St
- 1801 Highway 20 Unit 2
- 738 Webster St
- 745 Main St
- 1425 5th St
- 1732 Wescott Rd
- 1107 Market St
- 115 Country Club Dr
- 3869 River Rd
- 1450 Lake Ave Unit 15
- 3488 River Rd
- 7043 Christie Ln
- 414 Kittyhawk Rd
- 412 Kittyhawk Rd
- 410 Kittyhawk Rd
- 408 Kittyhawk Rd
Ask me questions while you tour the home.