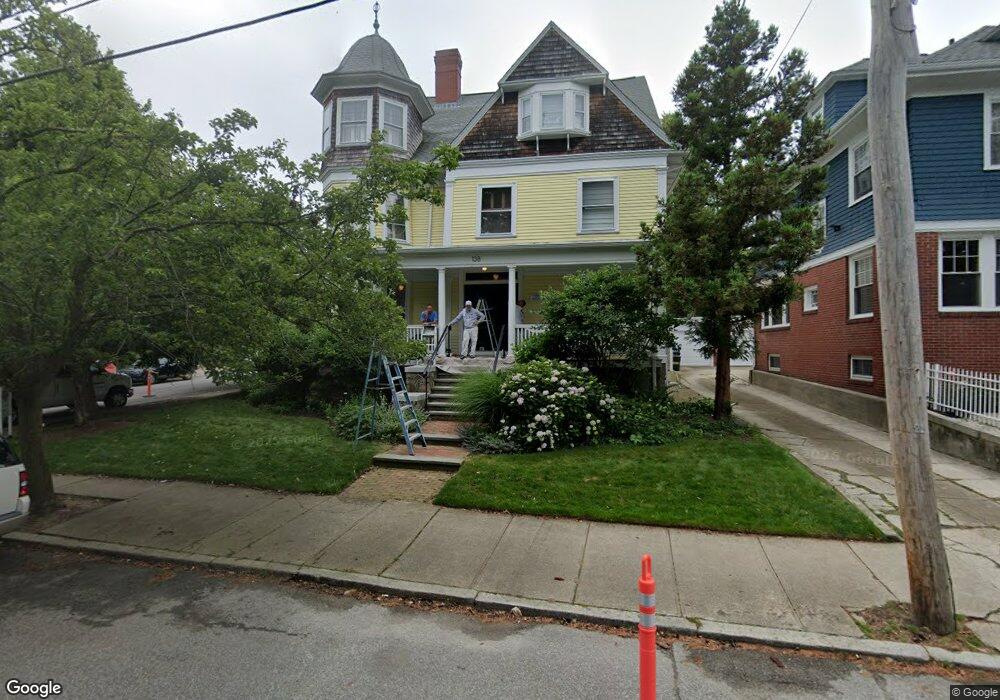
138 Governor St Unit 1 Providence, RI 02906
College Hill NeighborhoodEstimated Value: $849,000 - $1,221,000
3
Beds
4
Baths
2,500
Sq Ft
$401/Sq Ft
Est. Value
About This Home
This home is located at 138 Governor St Unit 1, Providence, RI 02906 and is currently estimated at $1,002,019, approximately $400 per square foot. 138 Governor St Unit 1 is a home located in Providence County with nearby schools including Asa Messer Elementary School, Charles N. Fortes Elementary School, and Robert L. Bailey IV Elementary.
Ownership History
Date
Name
Owned For
Owner Type
Purchase Details
Closed on
Jun 3, 2015
Sold by
Touafek Katherine and Telford Antoine
Bought by
Rose Christopher and Bell-Rose Stephanie K
Current Estimated Value
Home Financials for this Owner
Home Financials are based on the most recent Mortgage that was taken out on this home.
Original Mortgage
$191,750
Interest Rate
3.62%
Mortgage Type
New Conventional
Purchase Details
Closed on
Jul 15, 2010
Sold by
P Dodge Jr T N
Bought by
Touafek Katherine and Terford Antoine
Home Financials for this Owner
Home Financials are based on the most recent Mortgage that was taken out on this home.
Original Mortgage
$340,000
Interest Rate
4.82%
Purchase Details
Closed on
Feb 9, 2007
Sold by
Scotti Franchesco M and Strieck Patrick D
Bought by
Powell Tr Lawrence M and Strieck Patrick D
Create a Home Valuation Report for This Property
The Home Valuation Report is an in-depth analysis detailing your home's value as well as a comparison with similar homes in the area
Home Values in the Area
Average Home Value in this Area
Purchase History
| Date | Buyer | Sale Price | Title Company |
|---|---|---|---|
| Rose Christopher | $465,000 | -- | |
| Touafek Katherine | $425,000 | -- | |
| P Dodge Jr T N | $425,000 | -- | |
| Powell Tr Lawrence M | $495,000 | -- |
Source: Public Records
Mortgage History
| Date | Status | Borrower | Loan Amount |
|---|---|---|---|
| Closed | Powell Tr Lawrence M | $191,750 | |
| Closed | Powell Tr Lawrence M | $250,000 | |
| Previous Owner | Powell Tr Lawrence M | $372,800 | |
| Previous Owner | Powell Tr Lawrence M | $340,000 |
Source: Public Records
Tax History Compared to Growth
Tax History
| Year | Tax Paid | Tax Assessment Tax Assessment Total Assessment is a certain percentage of the fair market value that is determined by local assessors to be the total taxable value of land and additions on the property. | Land | Improvement |
|---|---|---|---|---|
| 2025 | $16,720 | $1,145,200 | $0 | $1,145,200 |
| 2024 | $14,469 | $788,500 | $0 | $788,500 |
| 2023 | $14,469 | $788,500 | $0 | $788,500 |
| 2022 | $14,035 | $788,500 | $0 | $788,500 |
| 2021 | $12,820 | $522,000 | $0 | $522,000 |
| 2020 | $12,820 | $522,000 | $0 | $522,000 |
| 2019 | $12,820 | $522,000 | $0 | $522,000 |
| 2018 | $13,513 | $422,800 | $0 | $422,800 |
| 2017 | $13,513 | $422,800 | $0 | $422,800 |
| 2016 | $13,513 | $422,800 | $0 | $422,800 |
| 2015 | $11,605 | $350,600 | $0 | $350,600 |
| 2014 | $11,833 | $350,600 | $0 | $350,600 |
| 2013 | -- | $350,600 | $0 | $350,600 |
Source: Public Records
Map
Nearby Homes
- 117 Benevolent St
- 20 E George St
- 207 Williams St Unit 2
- 165 Waterman St Unit 2
- 63 Pitman St Unit 5
- 63 Pitman St Unit 4
- 130 Gano St
- 130 Gano St Unit A
- 96 Gano St Unit 3
- 427 Wickenden St
- 104 Sheldon St
- 73 Trenton St
- 670 Wickenden St
- 124 Pitman St
- 323 Wickenden St
- 20 Taber Ave
- 273 Wickenden St
- 84 Transit St
- 41 Taber Ave
- 19 S Angell St Unit 2
- 138 Governor St Unit 2
- 130 Benevolent St
- 140 Governor St
- 146 Governor St
- 131 Benevolent St Unit TH
- 129 Benevolent St
- 279 George St
- 283 George St
- 123 Benevolent St
- 141 Governor St
- 121 Benevolent St
- 253 George St
- 7 E George St
- 120 Governor St
- 121-123 Governor Street East Side
- 147 Governor St
- 158 Governor St
- 26 Cooke St
- 118 Governor St
- 118 Governor St Unit 4