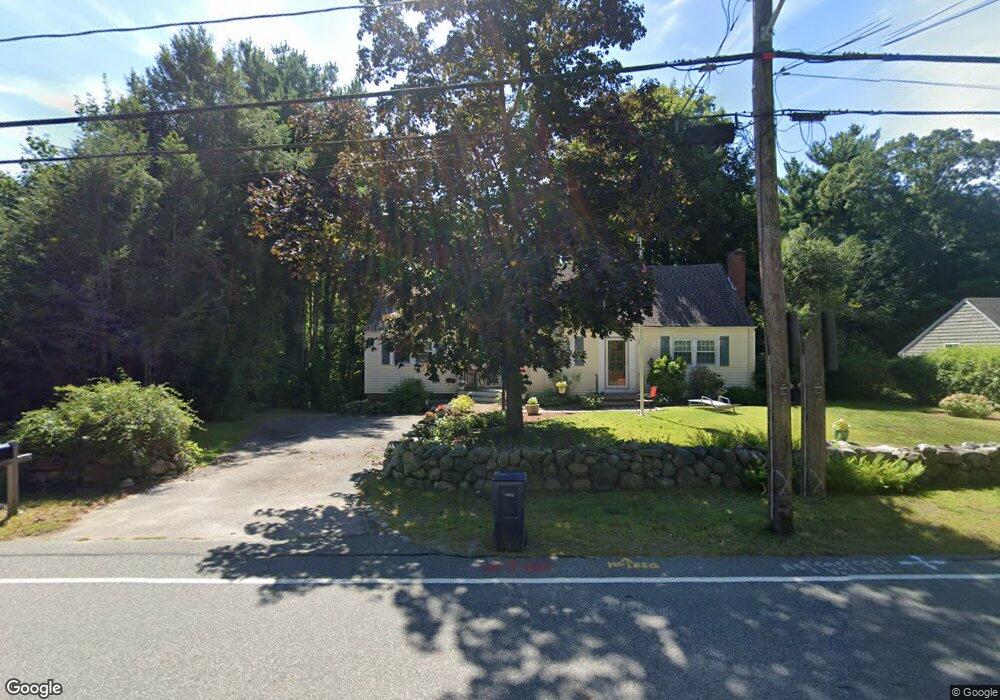
138 Grove St Norwell, MA 02061
Estimated Value: $780,000 - $822,017
3
Beds
2
Baths
1,824
Sq Ft
$443/Sq Ft
Est. Value
About This Home
This home is located at 138 Grove St, Norwell, MA 02061 and is currently estimated at $807,504, approximately $442 per square foot. 138 Grove St is a home located in Plymouth County with nearby schools including Grace Farrar Cole Elementary School, Norwell Middle School, and Norwell High School.
Ownership History
Date
Name
Owned For
Owner Type
Purchase Details
Closed on
Mar 21, 2007
Sold by
Ryan Cynthia A and Ryan John A
Bought by
Ryan John Arthur
Current Estimated Value
Purchase Details
Closed on
Feb 5, 2007
Sold by
Ryan Cynthia A
Bought by
Ryan John Arthur and Ryan Cynthia A
Purchase Details
Closed on
May 16, 2006
Sold by
Ryan Cynthia A and Ryan Cynthia L
Bought by
Ryan Cynthia A
Purchase Details
Closed on
Jun 15, 2004
Sold by
Ryan Ft and Ryan
Bought by
Ryan Cynthia L and Ryan John A
Create a Home Valuation Report for This Property
The Home Valuation Report is an in-depth analysis detailing your home's value as well as a comparison with similar homes in the area
Home Values in the Area
Average Home Value in this Area
Purchase History
| Date | Buyer | Sale Price | Title Company |
|---|---|---|---|
| Ryan John Arthur | -- | -- | |
| Ryan John Arthur | -- | -- | |
| Ryan John Arthur | -- | -- | |
| Ryan John Arthur | -- | -- | |
| Ryan Cynthia A | -- | -- | |
| Ryan Cynthia A | -- | -- | |
| Ryan Cynthia L | -- | -- | |
| Ryan Cynthia L | -- | -- |
Source: Public Records
Mortgage History
| Date | Status | Borrower | Loan Amount |
|---|---|---|---|
| Open | Ryan Cynthia L | $275,000 | |
| Closed | Ryan Cynthia L | $15,000 |
Source: Public Records
Tax History Compared to Growth
Tax History
| Year | Tax Paid | Tax Assessment Tax Assessment Total Assessment is a certain percentage of the fair market value that is determined by local assessors to be the total taxable value of land and additions on the property. | Land | Improvement |
|---|---|---|---|---|
| 2025 | $8,769 | $670,900 | $351,600 | $319,300 |
| 2024 | $8,384 | $622,900 | $331,800 | $291,100 |
| 2023 | $7,810 | $510,800 | $255,100 | $255,700 |
| 2022 | $7,464 | $449,100 | $221,800 | $227,300 |
| 2021 | $7,806 | $460,800 | $233,500 | $227,300 |
| 2020 | $7,705 | $463,300 | $233,500 | $229,800 |
| 2019 | $7,598 | $463,300 | $233,500 | $229,800 |
| 2018 | $6,930 | $424,100 | $213,600 | $210,500 |
| 2017 | $6,471 | $393,400 | $213,600 | $179,800 |
| 2016 | $6,435 | $390,000 | $213,600 | $176,400 |
| 2015 | $5,869 | $355,700 | $204,100 | $151,600 |
| 2014 | $5,964 | $364,300 | $204,100 | $160,200 |
Source: Public Records
Map
Nearby Homes
- 214 Washington St Unit 28
- 62 High St
- 4 Richard Rd
- 9 Damon Farm Way Unit 9
- 251 Prospect St
- 61 Scotland St
- 225 Prospect St
- 150 High St
- 1088 Main St
- 72 Scotland St
- 1193 Main St Unit C1
- 80 Coolidge Rd
- 225 Prospect St
- 433 Grove St
- 2 Hoover Rd
- 23 Mast Hill Rd
- 1 Kerri Ln
- 7 Assinippi Ave Unit 216
- 1239 Main St
- 5 Redwood Ct