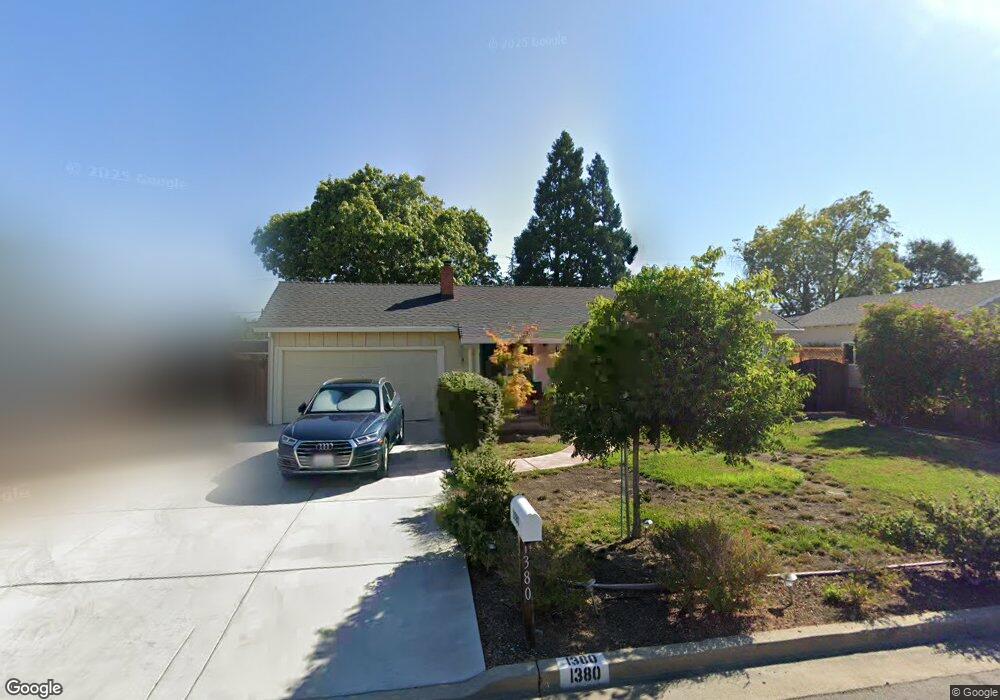
1380 Sharp Ave Campbell, CA 95008
Estimated Value: $1,343,000 - $1,699,000
3
Beds
1
Bath
1,012
Sq Ft
$1,508/Sq Ft
Est. Value
About This Home
This home is located at 1380 Sharp Ave, Campbell, CA 95008 and is currently estimated at $1,526,134, approximately $1,508 per square foot. 1380 Sharp Ave is a home located in Santa Clara County with nearby schools including Leigh High School, Branham High School, and Farnham Elementary School.
Ownership History
Date
Name
Owned For
Owner Type
Purchase Details
Closed on
Apr 10, 2013
Sold by
Collins Michael F and Collins Rosemary C
Bought by
Collins Michael F and Collins Rosemary Chavez
Current Estimated Value
Purchase Details
Closed on
Jul 8, 2009
Sold by
Dasalla Stephanie A
Bought by
Collins Michael F and Collins Rosemary C
Home Financials for this Owner
Home Financials are based on the most recent Mortgage that was taken out on this home.
Original Mortgage
$330,350
Outstanding Balance
$214,949
Interest Rate
5.25%
Mortgage Type
Purchase Money Mortgage
Estimated Equity
$1,311,185
Purchase Details
Closed on
Oct 30, 2004
Sold by
Tobar Joseph A and Tobar Margaret I
Bought by
Tobar Margaret I and Dasalla Stephanie A
Purchase Details
Closed on
Aug 31, 2004
Sold by
Tobar Joseph A and Tobar Margaret I
Bought by
Tobar Joseph A and Tobar Margaret I
Create a Home Valuation Report for This Property
The Home Valuation Report is an in-depth analysis detailing your home's value as well as a comparison with similar homes in the area
Home Values in the Area
Average Home Value in this Area
Purchase History
| Date | Buyer | Sale Price | Title Company |
|---|---|---|---|
| Collins Michael F | -- | None Available | |
| Collins Michael F | $413,000 | Chicago Title Company | |
| Tobar Margaret I | -- | -- | |
| Tobar Joseph A | -- | -- |
Source: Public Records
Mortgage History
| Date | Status | Borrower | Loan Amount |
|---|---|---|---|
| Open | Collins Michael F | $330,350 |
Source: Public Records
Tax History
| Year | Tax Paid | Tax Assessment Tax Assessment Total Assessment is a certain percentage of the fair market value that is determined by local assessors to be the total taxable value of land and additions on the property. | Land | Improvement |
|---|---|---|---|---|
| 2025 | $7,928 | $570,207 | $399,502 | $170,705 |
| 2024 | $7,928 | $559,027 | $391,669 | $167,358 |
| 2023 | $7,912 | $548,067 | $383,990 | $164,077 |
| 2022 | $7,794 | $537,321 | $376,461 | $160,860 |
| 2021 | $7,634 | $526,786 | $369,080 | $157,706 |
| 2020 | $7,286 | $521,385 | $365,296 | $156,089 |
| 2019 | $7,176 | $511,163 | $358,134 | $153,029 |
| 2018 | $6,951 | $501,141 | $351,112 | $150,029 |
| 2017 | $6,769 | $491,316 | $344,228 | $147,088 |
| 2016 | $6,339 | $481,683 | $337,479 | $144,204 |
| 2015 | $6,241 | $474,448 | $332,410 | $142,038 |
| 2014 | $6,058 | $465,155 | $325,899 | $139,256 |
Source: Public Records
Map
Nearby Homes
- 1500 Camden Ave
- 404 Shamrock Dr
- 1526 Redding Park Ln
- 1155 Shamrock Dr
- 135 Redding Rd Unit A
- 3449 Wine Cask Way
- 3492 Wine Barrel Way
- 101 Redding Rd Unit A4
- 2289 Sun Glory Ln Unit A
- 1061 Shamrock Dr
- 2265 Sun Glory Ln Unit A
- 2265 Sun Glory Ln Unit B
- 2178 Casa Mia Dr
- 956 Norin Ct
- 3673 S Bascom Ave
- 341 Dallas Dr
- 401 Dallas Dr
- 481 Dallas Dr
- 3685 Calvin Ave
- 1054 Longfellow Ave
- 1390 Sharp Ave
- 1366 Sharp Ave
- 1385 Sharp Ct
- 1350 Sharp Ave
- 1400 Sharp Ave
- 1351 Sharp Ave
- 1410 Sharp Ave
- 1340 Sharp Ave
- 1395 Sharp Ct
- 1421 Sharp Ave
- 1490 Camden Ave
- 1476 Camden Ave
- 1426 Sharp Ave
- 1370 Parsons Ave
- 1415 Sharp Ct
- 1326 Sharp Ave
- 1386 Parsons Ave
- 1412 Camden Ave
- 1405 Sharp Ct
- 1404 Parsons Ave
Your Personal Tour Guide
Ask me questions while you tour the home.