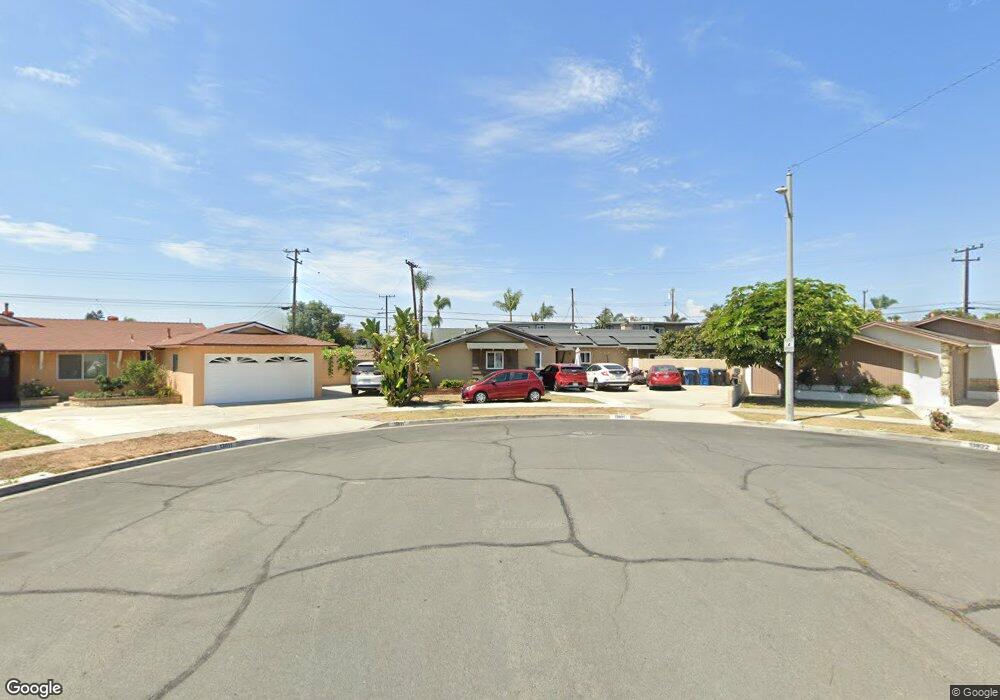
13801 Busby Cir Westminster, CA 92683
Estimated Value: $966,000 - $1,046,389
4
Beds
2
Baths
1,556
Sq Ft
$646/Sq Ft
Est. Value
About This Home
This home is located at 13801 Busby Cir, Westminster, CA 92683 and is currently estimated at $1,005,597, approximately $646 per square foot. 13801 Busby Cir is a home located in Orange County with nearby schools including Finley Elementary, Johnson Middle, and Westminster High School.
Ownership History
Date
Name
Owned For
Owner Type
Purchase Details
Closed on
Feb 12, 2021
Sold by
Azucena Leonila Y and Leonila Y Azucena Revocable Li
Bought by
Azucena Leonila Y
Current Estimated Value
Home Financials for this Owner
Home Financials are based on the most recent Mortgage that was taken out on this home.
Original Mortgage
$544,000
Outstanding Balance
$486,127
Interest Rate
2.65%
Mortgage Type
New Conventional
Estimated Equity
$519,470
Purchase Details
Closed on
May 21, 2018
Sold by
Azucena Leonila Ywayan
Bought by
Azucena Leonila Y and The Leonila Y Azucena Revocable Living T
Purchase Details
Closed on
Jan 27, 1994
Sold by
Trussell Barry A
Bought by
Manabat Leonila A
Home Financials for this Owner
Home Financials are based on the most recent Mortgage that was taken out on this home.
Original Mortgage
$154,750
Interest Rate
7.09%
Create a Home Valuation Report for This Property
The Home Valuation Report is an in-depth analysis detailing your home's value as well as a comparison with similar homes in the area
Home Values in the Area
Average Home Value in this Area
Purchase History
| Date | Buyer | Sale Price | Title Company |
|---|---|---|---|
| Azucena Leonila Y | -- | Provident Title Company | |
| Azucena Leonila Y | -- | None Available | |
| Manabat Leonila A | $163,000 | Continental Lawyers Title Co |
Source: Public Records
Mortgage History
| Date | Status | Borrower | Loan Amount |
|---|---|---|---|
| Open | Azucena Leonila Y | $544,000 | |
| Previous Owner | Manabat Leonila A | $154,750 |
Source: Public Records
Tax History Compared to Growth
Tax History
| Year | Tax Paid | Tax Assessment Tax Assessment Total Assessment is a certain percentage of the fair market value that is determined by local assessors to be the total taxable value of land and additions on the property. | Land | Improvement |
|---|---|---|---|---|
| 2025 | $3,636 | $276,864 | $176,682 | $100,182 |
| 2024 | $3,636 | $271,436 | $173,218 | $98,218 |
| 2023 | $3,512 | $266,114 | $169,821 | $96,293 |
| 2022 | $3,452 | $260,897 | $166,492 | $94,405 |
| 2021 | $3,361 | $255,782 | $163,228 | $92,554 |
| 2020 | $12,152 | $253,160 | $161,555 | $91,605 |
| 2019 | $12,117 | $248,197 | $158,388 | $89,809 |
| 2018 | $12,108 | $243,331 | $155,282 | $88,049 |
| 2017 | $11,974 | $238,560 | $152,237 | $86,323 |
| 2016 | $11,897 | $233,883 | $149,252 | $84,631 |
| 2015 | $11,917 | $230,370 | $147,010 | $83,360 |
| 2014 | $3,038 | $225,858 | $144,130 | $81,728 |
Source: Public Records
Map
Nearby Homes
- 13688 Eastbridge St
- 13671 Sutter Dr
- 13472 Willamette Dr
- 13731 Springdale St
- 6751 Klondike Ave
- 6532 Bestel Ave
- 13671 Springdale St
- 14281 Edwards St
- 13562 Springdale St
- 13592 Yosemite Dr
- 13861 Pine St
- 13371 Springdale St
- 5781 Vallecito Dr
- 13722 Hammon Place
- 5781 Westmoreland Cir
- 5932 Chinook Dr
- 5792 Gloucester Cir
- Plan 2 at Solara
- Plan 1 at Solara
- Plan 3 at Solara
- 13822 Busby Cir
- 13811 Busby Cir
- 13792 Willow Ln
- 13832 Busby Cir
- 13831 Busby Cir
- 13802 Willow Ln
- 13782 Willow Ln
- 13811 Barker Cir
- 13801 Barker Cir
- 13822 Willow Ln
- 13842 Busby Cir
- 13841 Busby Cir
- 13831 Barker Cir
- 13762 Willow Ln
- 13832 Willow Ln
- 13841 Barker Cir
- 13842 Willow Ln
- 13752 Willow Ln
- 13751 Edwards St
- 6332 Abraham Ave