Estimated Value: $804,565 - $923,000
3
Beds
2
Baths
1,727
Sq Ft
$499/Sq Ft
Est. Value
About This Home
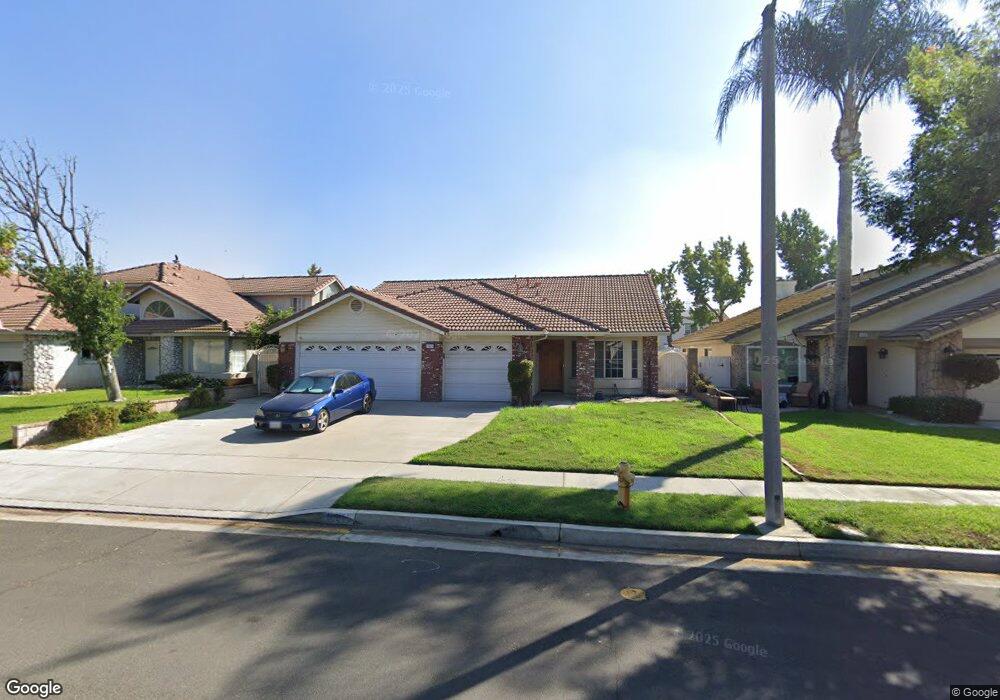
This home is located at 13829 Cherry Ave, Chino, CA 91710 and is currently estimated at $862,391, approximately $499 per square foot. 13829 Cherry Ave is a home located in San Bernardino County with nearby schools including Edwin Rhodes Elementary, Magnolia Junior High, and Chino High School.
Ownership History
Date
Name
Owned For
Owner Type
Purchase Details
Closed on
May 11, 2009
Sold by
Zepeda Manuel and Zepeda Girlie
Bought by
Fong Roger and Fong Pamela L
Current Estimated Value
Purchase Details
Closed on
May 18, 2005
Sold by
Carrillo Alex J and Carrillo Tara
Bought by
Zepeda Manuel and Zepeda Girlie
Home Financials for this Owner
Home Financials are based on the most recent Mortgage that was taken out on this home.
Original Mortgage
$439,200
Interest Rate
6.69%
Mortgage Type
New Conventional
Purchase Details
Closed on
Jan 28, 2000
Sold by
Apodaca Paul
Bought by
Carrillo Alex J and Carrillo Tara
Home Financials for this Owner
Home Financials are based on the most recent Mortgage that was taken out on this home.
Original Mortgage
$207,575
Interest Rate
8.3%
Create a Home Valuation Report for This Property
The Home Valuation Report is an in-depth analysis detailing your home's value as well as a comparison with similar homes in the area
Home Values in the Area
Average Home Value in this Area
Purchase History
| Date | Buyer | Sale Price | Title Company |
|---|---|---|---|
| Fong Roger | $305,000 | Netco Title | |
| Zepeda Manuel | $549,000 | Southland Title | |
| Carrillo Alex J | $218,500 | First American Title Ins Co |
Source: Public Records
Mortgage History
| Date | Status | Borrower | Loan Amount |
|---|---|---|---|
| Previous Owner | Zepeda Manuel | $439,200 | |
| Previous Owner | Carrillo Alex J | $207,575 |
Source: Public Records
Tax History
| Year | Tax Paid | Tax Assessment Tax Assessment Total Assessment is a certain percentage of the fair market value that is determined by local assessors to be the total taxable value of land and additions on the property. | Land | Improvement |
|---|---|---|---|---|
| 2025 | $4,562 | $392,767 | $137,471 | $255,296 |
| 2024 | $4,446 | $385,065 | $134,775 | $250,290 |
| 2023 | $4,328 | $377,514 | $132,132 | $245,382 |
| 2022 | $4,303 | $370,112 | $129,541 | $240,571 |
| 2021 | $4,223 | $362,855 | $127,001 | $235,854 |
| 2020 | $4,171 | $359,135 | $125,699 | $233,436 |
| 2019 | $4,101 | $352,093 | $123,234 | $228,859 |
| 2018 | $4,014 | $345,190 | $120,818 | $224,372 |
| 2017 | $3,946 | $338,422 | $118,449 | $219,973 |
| 2016 | $3,699 | $331,786 | $116,126 | $215,660 |
| 2015 | $3,629 | $326,803 | $114,382 | $212,421 |
| 2014 | $3,560 | $320,401 | $112,141 | $208,260 |
Source: Public Records
Map
Nearby Homes
- 6952 Silverado St
- 13846 Farmhouse Ave
- 6732 Sugar Pine St
- 6614 Manzanita Ct
- 6594 Manzanita Ct
- 13462 Mashona Ave
- 14000 San Antonio Ave
- 14170 Durazno Ave
- 6956 Larochelle Way
- 13266 Murano Ave Unit 19
- 6956 Dublin Dr
- 13290 San Antonio Ave
- 14415 Figueroa Ln
- 14380 Belhaven Ave
- 6829 Birmingham Dr
- 14349 Guilford Ave
- 13284 Cypress Ave
- 4602 Granville Ct
- 11610 Granville Place
- 6641 Eucalyptus Ave
- 13837 Cherry Ave
- 13821 Cherry Ave
- 13813 Cherry Ave
- 13845 Cherry Ave
- 13853 Cherry Ave
- 13832 Cherry Ave
- 13805 Cherry Ave
- 13840 Cherry Ave
- 13824 Cherry Ave
- 13848 Cherry Ave
- 13844 Old Mill Ave
- 13838 Old Mill Ave
- 13816 Cherry Ave
- 13830 Old Mill Ave
- 13867 Cherry Ave
- 6910 Old Mill Ave
- 13856 Cherry Ave
- 6912 Old Mill Ave
- 6914 Old Mill Ave
- 6916 Old Mill Ave
Your Personal Tour Guide
Ask me questions while you tour the home.