
Seller's Agent in 2025
Rhonda Grochowski
Charles Rutenberg Realty of IL
80 in this area
91 Total Sales
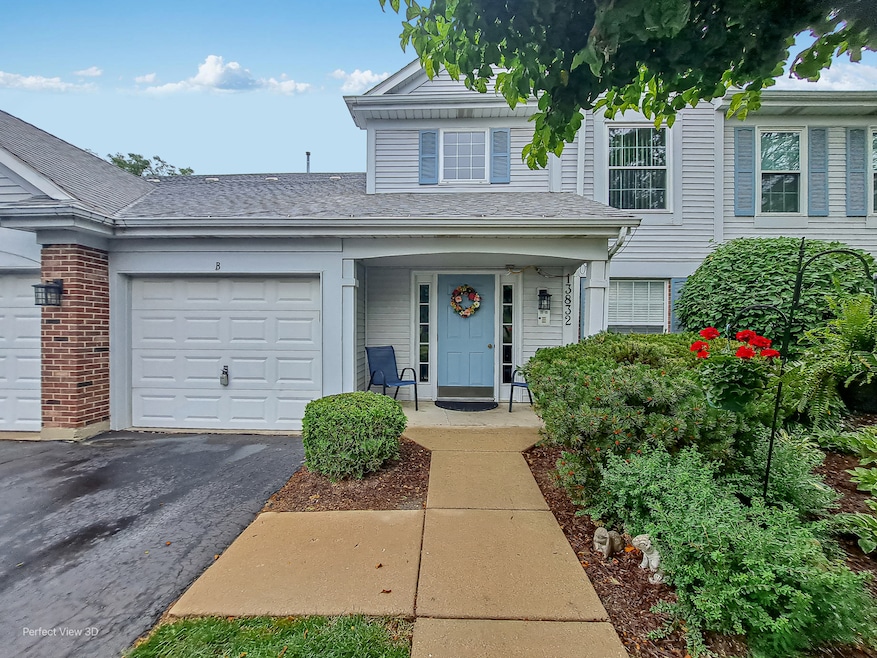

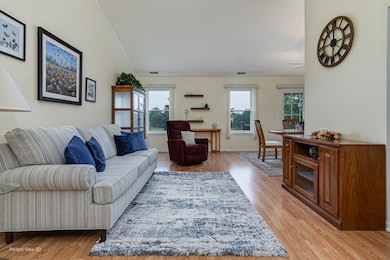

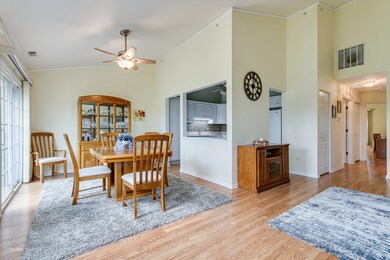

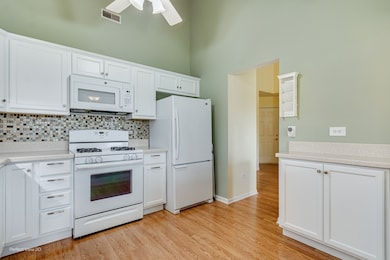
Stunning second floor unit with gorgeous panoramic golf course views! This move-in ready home has been beautifully updated and maintained. Located in Carillon's 55+ active adult resort style community, you are not just buying a home, but a lifestyle! This home includes vaulted ceiling, white trim and 6 panel doors, wood laminate flooring in living room, kitchen, dining room and kitchen - no carpet! The kitchen has been updated with ceiling fan, white cabinets and appliances, tile backsplash and brushed nickel pull down faucet. The spacious dining room has sliding glass door to balcony complete with a remote operated awning. The primary bedroom features a walk-in closet and private bath. Both bathrooms offer an updated white vanity with solid surface top and brushed nickel faucet plus comfort height toilets. The laundry room has a full sized washer and dryer with storage shelf. All the big items have been replaced: hvac and windows. Carillon offers 3 pools, tennis and pickleball courts, 3 9-hole golf courses, seasonal restaurant and clubhouse with tons of activities. This is a gated community with 24 hour security. Welcome home!
Last Agent to Sell the Property
Charles Rutenberg Realty of IL License #475105276 Listed on: 06/14/2025
Last Buyer's Agent
Scott Wiley
Redfin Corporation License #475132749
| Date | Type | Sale Price | Title Company |
|---|---|---|---|
| Deed | $237,500 | First American Title | |
| Interfamily Deed Transfer | -- | None Available | |
| Warranty Deed | $105,000 | None Available | |
| Quit Claim Deed | -- | Multiple | |
| Joint Tenancy Deed | $107,000 | Chicago Title Insurance Co |
| Date | Status | Loan Amount | Loan Type |
|---|---|---|---|
| Previous Owner | $75,000 | New Conventional | |
| Previous Owner | $237,000 | Reverse Mortgage Home Equity Conversion Mortgage |
| Date | Event | Price | List to Sale | Price per Sq Ft |
|---|---|---|---|---|
| 07/24/2025 07/24/25 | Sold | $237,500 | -1.0% | $215 / Sq Ft |
| 06/30/2025 06/30/25 | Price Changed | $239,900 | -2.1% | $217 / Sq Ft |
| 06/14/2025 06/14/25 | For Sale | $245,000 | -- | $222 / Sq Ft |
| Year | Tax Paid | Tax Assessment Tax Assessment Total Assessment is a certain percentage of the fair market value that is determined by local assessors to be the total taxable value of land and additions on the property. | Land | Improvement |
|---|---|---|---|---|
| 2024 | $1,329 | $60,483 | $14,236 | $46,247 |
| 2023 | $1,329 | $54,298 | $12,780 | $41,518 |
| 2022 | $1,399 | $50,649 | $11,921 | $38,728 |
| 2021 | $1,958 | $47,598 | $11,203 | $36,395 |
| 2020 | $1,977 | $46,033 | $10,835 | $35,198 |
| 2019 | $1,985 | $43,633 | $10,270 | $33,363 |
| 2018 | $2,013 | $40,737 | $9,588 | $31,149 |
| 2017 | $2,018 | $38,456 | $9,051 | $29,405 |
| 2016 | $2,049 | $35,130 | $8,269 | $26,861 |
| 2015 | $2,348 | $31,239 | $7,353 | $23,886 |
| 2014 | $2,348 | $30,329 | $7,139 | $23,190 |
| 2013 | $2,348 | $32,967 | $7,760 | $25,207 |
Seller's Agent in 2025
Rhonda Grochowski
Charles Rutenberg Realty of IL
80 in this area
91 Total Sales
S
Buyer's Agent in 2025
Scott Wiley
Redfin Corporation
Source: Midwest Real Estate Data (MRED)
MLS Number: 12393757
APN: 11-04-06-176-022-1004
Disclaimer: Certain information contained herein is derived from information provided by parties other than Homes.com. All information provided is deemed reliable, but is not guaranteed to be accurate and should be independently verified.
![]() Based on information submitted to the MLS GRID. All data is obtained from various sources and may not have been verified by broker or MLS GRID. Supplied Open House Information is subject to change without notice. All information should be independently reviewed and verified for accuracy. Properties may or may not be listed by the office/agent presenting the information. Some IDX listings have been excluded from this website.
Based on information submitted to the MLS GRID. All data is obtained from various sources and may not have been verified by broker or MLS GRID. Supplied Open House Information is subject to change without notice. All information should be independently reviewed and verified for accuracy. Properties may or may not be listed by the office/agent presenting the information. Some IDX listings have been excluded from this website.
The Digital Millennium Copyright Act of 1998, 17 U.S.C. § 512 (the “DMCA”) provides recourse for copyright owners who believe that material appearing on the Internet infringes their rights under U.S. copyright law. If you believe in good faith that any content or material made available in connection with our website or services infringes your copyright, you (or your agent) may send us a notice requesting that the content or material be removed, or access to it blocked.
Notices must be sent in writing by email to DMCAnotice@MLSGrid.com.
The DMCA requires that your notice of alleged copyright infringement include the following information:
(1) description of the copyrighted work that is the subject of claimed infringement;
(2) description of the alleged infringing content and information sufficient to permit us to locate the content;
(3) contact information for you, including your address, telephone number and email address;
(4) a statement by you that you have a good faith belief that the content in the manner complained of is not authorized by the copyright owner, or its agent, or by the operation of any law;
(5) a statement by you, signed under penalty of perjury, that the information in the notification is accurate and that you have the authority to enforce the copyrights that are claimed to be infringed; and
(6) a physical or electronic signature of the copyright owner or a person authorized to act on the copyright owner’s behalf. Failure to include all of the above information may result in the delay of the processing of your complaint.