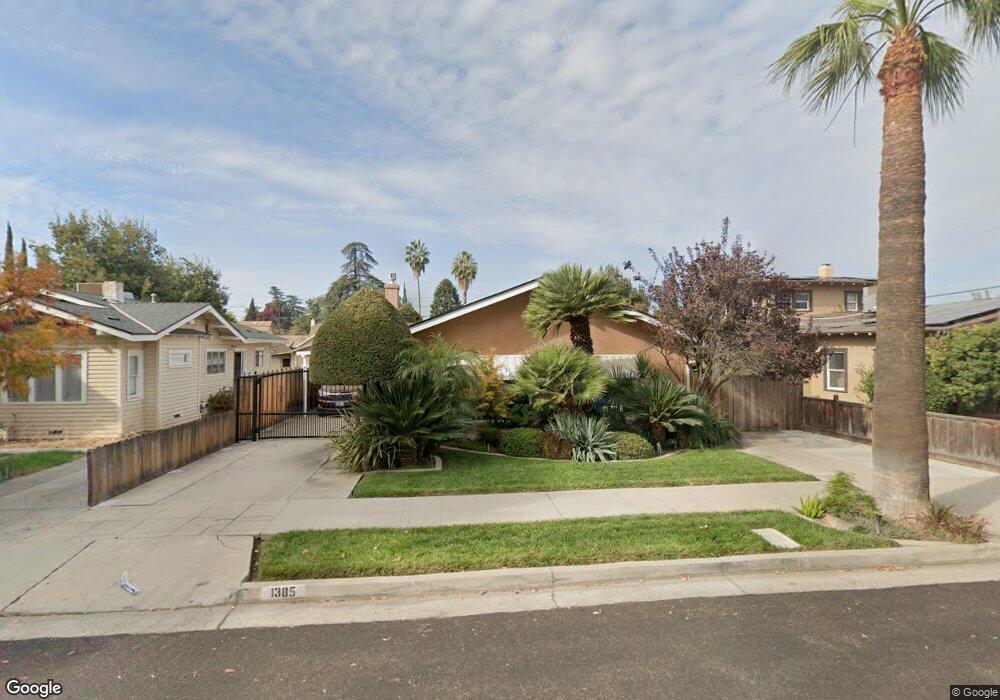
1385 N College Ave Fresno, CA 93728
Tower District NeighborhoodEstimated Value: $352,489 - $385,000
3
Beds
3
Baths
1,684
Sq Ft
$222/Sq Ft
Est. Value
About This Home
This home is located at 1385 N College Ave, Fresno, CA 93728 and is currently estimated at $374,372, approximately $222 per square foot. 1385 N College Ave is a home located in Fresno County with nearby schools including Heaton Elementary, Fort Miller Middle School, and Fresno High School.
Ownership History
Date
Name
Owned For
Owner Type
Purchase Details
Closed on
Jul 11, 2016
Sold by
Hernandez Elsa Marie
Bought by
Hernandez John
Current Estimated Value
Home Financials for this Owner
Home Financials are based on the most recent Mortgage that was taken out on this home.
Original Mortgage
$34,500
Outstanding Balance
$25,260
Interest Rate
3.66%
Mortgage Type
Credit Line Revolving
Estimated Equity
$349,112
Purchase Details
Closed on
Dec 6, 1993
Sold by
Hartwell Barbara H Brandt
Bought by
Hartwell David Gene
Home Financials for this Owner
Home Financials are based on the most recent Mortgage that was taken out on this home.
Original Mortgage
$73,027
Interest Rate
7.16%
Mortgage Type
FHA
Purchase Details
Closed on
Oct 25, 1993
Sold by
Warford Terrance P and Hartwell David Gene
Bought by
Hernandez John
Home Financials for this Owner
Home Financials are based on the most recent Mortgage that was taken out on this home.
Original Mortgage
$73,027
Interest Rate
7.16%
Mortgage Type
FHA
Create a Home Valuation Report for This Property
The Home Valuation Report is an in-depth analysis detailing your home's value as well as a comparison with similar homes in the area
Home Values in the Area
Average Home Value in this Area
Purchase History
| Date | Buyer | Sale Price | Title Company |
|---|---|---|---|
| Hernandez John | -- | Placer Title | |
| Hernandez John | -- | Placer Title Company | |
| Hartwell David Gene | -- | Landmark Title Company | |
| Hernandez John | -- | Landmark Title Company |
Source: Public Records
Mortgage History
| Date | Status | Borrower | Loan Amount |
|---|---|---|---|
| Open | Hernandez John | $34,500 | |
| Previous Owner | Hernandez John | $73,027 |
Source: Public Records
Tax History Compared to Growth
Tax History
| Year | Tax Paid | Tax Assessment Tax Assessment Total Assessment is a certain percentage of the fair market value that is determined by local assessors to be the total taxable value of land and additions on the property. | Land | Improvement |
|---|---|---|---|---|
| 2025 | $1,490 | $124,039 | $23,779 | $100,260 |
| 2023 | $1,460 | $119,224 | $22,856 | $96,368 |
| 2022 | $1,438 | $116,887 | $22,408 | $94,479 |
| 2021 | $1,398 | $114,596 | $21,969 | $92,627 |
| 2020 | $1,391 | $113,422 | $21,744 | $91,678 |
| 2019 | $1,337 | $111,199 | $21,318 | $89,881 |
| 2018 | $1,307 | $109,019 | $20,900 | $88,119 |
| 2017 | $1,283 | $106,883 | $20,491 | $86,392 |
| 2016 | $1,240 | $104,789 | $20,090 | $84,699 |
| 2015 | $1,220 | $103,216 | $19,789 | $83,427 |
| 2014 | $1,193 | $101,195 | $19,402 | $81,793 |
Source: Public Records
Map
Nearby Homes
- 1311 N Van Ness Ave
- 1452 N Poplar Ave
- 1504 N Van Ness Ave
- 1334 N Glenn Ave
- 721 E Home Ave
- 1303 N Calaveras St
- 666 E Carmen Ave
- 605 E Home Ave
- 1336 N Roosevelt Ave
- 1355 N Roosevelt Ave
- 626 E University Ave
- 1591 N Roosevelt Ave
- 807 N Van Ness Ave
- 1220 N Abby St
- 745 E La Sierra Dr
- 1327 N Ferger Ave
- 1565 N Wilson Ave
- 930 N Roosevelt Ave
- 630 E Dudley Ave
- 706 N College Ave
- 1375 N College Ave
- 1393 N College Ave
- 1369 N College Ave
- 1386 N Van Ness Ave
- 1376 N Van Ness Ave
- 1396 N Van Ness Ave
- 1361 N College Ave
- 1370 N Van Ness Ave
- 1401 N College Ave
- 1392 N College Ave
- 1394 N College Ave
- 1358 N Van Ness Ave
- 1384 N College Ave
- 1353 N College Ave
- 1376 N College Ave
- 1411 N College Ave
- 1364 N College Ave
- 1103 E Floradora Ave
- 1114 E Floradora Ave
- 1345 N College Ave