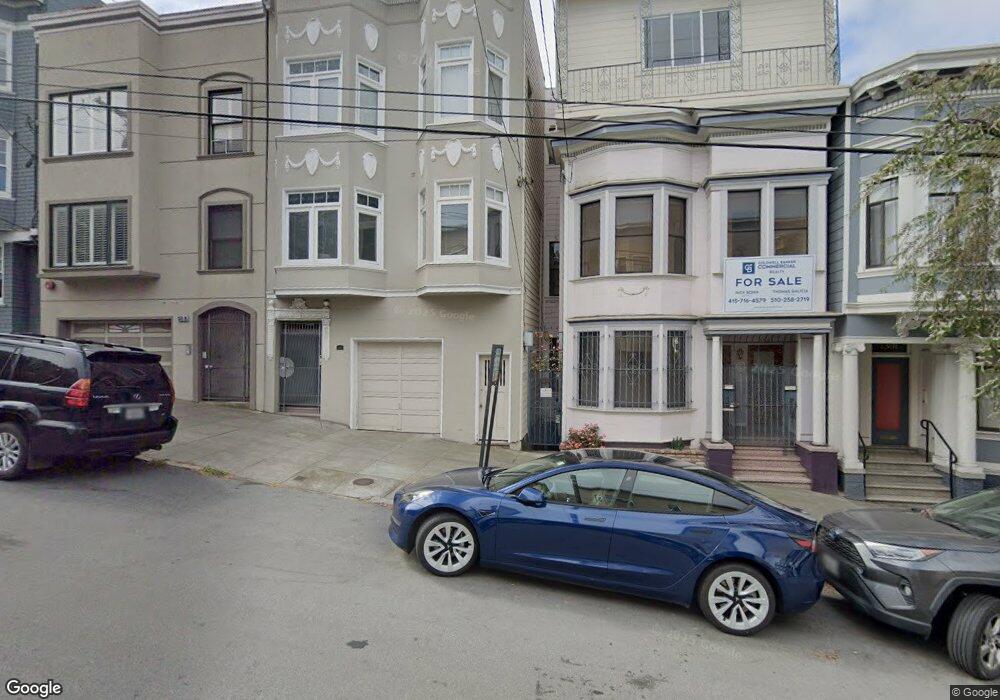
1385 Vallejo St Unit 1387 San Francisco, CA 94109
Russian Hill NeighborhoodEstimated Value: $1,703,571 - $1,743,000
--
Bed
2
Baths
2,832
Sq Ft
$606/Sq Ft
Est. Value
About This Home
This home is located at 1385 Vallejo St Unit 1387, San Francisco, CA 94109 and is currently estimated at $1,716,393, approximately $606 per square foot. 1385 Vallejo St Unit 1387 is a home located in San Francisco County with nearby schools including Yick Wo Elementary School, Francisco Middle School, and Saint Brigid Academy.
Ownership History
Date
Name
Owned For
Owner Type
Purchase Details
Closed on
Jul 1, 2025
Sold by
Quan Yung Go Revocable Trust and Go Marilyn
Bought by
Ho Jihshin
Current Estimated Value
Home Financials for this Owner
Home Financials are based on the most recent Mortgage that was taken out on this home.
Original Mortgage
$850,000
Outstanding Balance
$848,563
Interest Rate
6.86%
Mortgage Type
Construction
Estimated Equity
$867,830
Purchase Details
Closed on
Jun 30, 2025
Sold by
Morrow Mary
Bought by
Ho Jihshin
Home Financials for this Owner
Home Financials are based on the most recent Mortgage that was taken out on this home.
Original Mortgage
$850,000
Outstanding Balance
$848,563
Interest Rate
6.86%
Mortgage Type
Construction
Estimated Equity
$867,830
Purchase Details
Closed on
Jul 14, 2015
Sold by
Go Marian
Bought by
Go Marian
Purchase Details
Closed on
Oct 20, 2005
Sold by
Embry John H
Bought by
Embry John H
Purchase Details
Closed on
Sep 2, 1997
Sold by
Yung Go Quan
Bought by
Go Quan Yung
Create a Home Valuation Report for This Property
The Home Valuation Report is an in-depth analysis detailing your home's value as well as a comparison with similar homes in the area
Home Values in the Area
Average Home Value in this Area
Purchase History
| Date | Buyer | Sale Price | Title Company |
|---|---|---|---|
| Ho Jihshin | -- | Old Republic Title | |
| Ho Jihshin | -- | Old Republic Title | |
| Go Marian | -- | None Available | |
| Embry John H | -- | -- | |
| Go Quan Yung | -- | -- |
Source: Public Records
Mortgage History
| Date | Status | Borrower | Loan Amount |
|---|---|---|---|
| Open | Ho Jihshin | $850,000 |
Source: Public Records
Tax History Compared to Growth
Tax History
| Year | Tax Paid | Tax Assessment Tax Assessment Total Assessment is a certain percentage of the fair market value that is determined by local assessors to be the total taxable value of land and additions on the property. | Land | Improvement |
|---|---|---|---|---|
| 2025 | $1,755 | $141,276 | $56,542 | $84,734 |
| 2024 | $1,755 | $138,508 | $55,434 | $83,074 |
| 2023 | $1,731 | $135,794 | $54,348 | $81,446 |
| 2022 | $2,303 | $133,134 | $53,284 | $79,850 |
| 2021 | $2,257 | $130,526 | $52,240 | $78,286 |
| 2020 | $2,388 | $129,190 | $51,706 | $77,484 |
| 2019 | $2,844 | $126,660 | $50,694 | $75,966 |
| 2018 | $2,922 | $124,178 | $49,700 | $74,478 |
| 2017 | $1,909 | $121,744 | $48,726 | $73,018 |
| 2016 | $1,840 | $119,360 | $47,772 | $71,588 |
| 2015 | $1,810 | $117,599 | $47,074 | $70,525 |
| 2014 | -- | $115,296 | $46,152 | $69,144 |
Source: Public Records
Map
Nearby Homes
- 2145 Larkin St
- 1725 Hyde St Unit 1
- 1728 Larkin St
- 1601 Hyde St
- 1601 Pacific Ave Unit 207
- 1396 Pacific Ave Unit 1398
- 74 Lynch St
- 68 Lynch St
- 2160 Van Ness Ave
- 1250 Vallejo St Unit 7
- 1250 Vallejo St Unit 9
- 1438 Green St Unit 3D
- 1145 Green St Unit 3
- 44 Lynch St
- 1519-1521 Jackson St
- 1754 Larkin St Unit 5
- 16 Delgado Place
- 1135 Green St
- 1740 Larkin St
- 1567 Jackson St
- 1391 Vallejo St Unit 1393
- 1379 Vallejo St Unit 1
- 1379 Vallejo St Unit 4
- 1379 Vallejo St
- 1379 Vallejo St Unit 5
- 1379 Vallejo St Unit 2
- 1373 Vallejo St
- 1397 Vallejo St Unit 1399
- 1375 Vallejo St
- 2040 Larkin St Unit 2044
- 1367 Vallejo St
- 2034 Larkin St
- 2036 Larkin St
- 2032 Larkin St
- 1363 Vallejo St Unit 1365
- 2028 Larkin St Unit 2030
- 1359 Vallejo St Unit 1361
- 1378 Vallejo St
- 2102 Larkin St
- 1362 Vallejo St Unit D