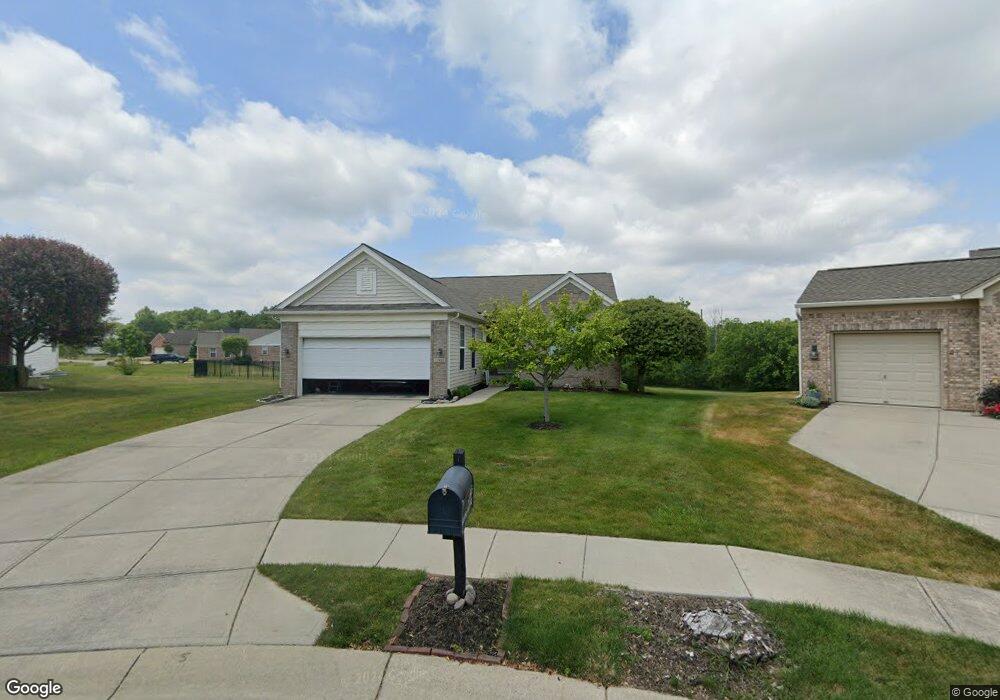
13863 Marble Arch Way Fishers, IN 46037
Estimated Value: $450,003 - $518,000
3
Beds
3
Baths
1,724
Sq Ft
$278/Sq Ft
Est. Value
About This Home
This home is located at 13863 Marble Arch Way, Fishers, IN 46037 and is currently estimated at $480,001, approximately $278 per square foot. 13863 Marble Arch Way is a home located in Hamilton County with nearby schools including Overland Park Elementary School, Thorpe Creek Elementary School, and Hamilton Southeastern Intermediate / Junior High.
Ownership History
Date
Name
Owned For
Owner Type
Purchase Details
Closed on
Aug 13, 2019
Sold by
Nuss Betty J and Betty J Nuss Living Trust
Bought by
Hudson Russell and Hudson Jeralene
Current Estimated Value
Home Financials for this Owner
Home Financials are based on the most recent Mortgage that was taken out on this home.
Original Mortgage
$307,000
Outstanding Balance
$268,875
Interest Rate
3.7%
Mortgage Type
VA
Estimated Equity
$211,126
Purchase Details
Closed on
Sep 30, 2016
Sold by
Snead Dale S
Bought by
Schuch Angela K
Home Financials for this Owner
Home Financials are based on the most recent Mortgage that was taken out on this home.
Original Mortgage
$227,715
Interest Rate
3.43%
Mortgage Type
New Conventional
Purchase Details
Closed on
Sep 20, 2011
Sold by
Snead Shelley R
Bought by
Snead Dale S
Purchase Details
Closed on
Feb 28, 2005
Sold by
Pulte Homes Of Indiana Llc
Bought by
Snead Dale S and Snead Shelly R
Create a Home Valuation Report for This Property
The Home Valuation Report is an in-depth analysis detailing your home's value as well as a comparison with similar homes in the area
Home Values in the Area
Average Home Value in this Area
Purchase History
| Date | Buyer | Sale Price | Title Company |
|---|---|---|---|
| Hudson Russell | -- | None Available | |
| Schuch Angela K | -- | None Available | |
| Snead Dale S | -- | None Available | |
| Snead Dale S | -- | -- |
Source: Public Records
Mortgage History
| Date | Status | Borrower | Loan Amount |
|---|---|---|---|
| Open | Hudson Russell | $307,000 | |
| Previous Owner | Schuch Angela K | $227,715 |
Source: Public Records
Tax History Compared to Growth
Tax History
| Year | Tax Paid | Tax Assessment Tax Assessment Total Assessment is a certain percentage of the fair market value that is determined by local assessors to be the total taxable value of land and additions on the property. | Land | Improvement |
|---|---|---|---|---|
| 2024 | $4,215 | $385,700 | $78,700 | $307,000 |
| 2023 | $4,215 | $372,200 | $78,700 | $293,500 |
| 2022 | $3,979 | $332,700 | $78,700 | $254,000 |
| 2021 | $3,653 | $306,100 | $78,700 | $227,400 |
| 2020 | $3,532 | $292,400 | $78,700 | $213,700 |
| 2019 | $3,371 | $279,400 | $52,100 | $227,300 |
| 2018 | $3,181 | $263,400 | $52,100 | $211,300 |
| 2017 | $3,119 | $262,400 | $53,200 | $209,200 |
| 2016 | $3,212 | $270,200 | $53,200 | $217,000 |
| 2014 | $5,246 | $245,800 | $53,200 | $192,600 |
| 2013 | $5,246 | $242,100 | $53,200 | $188,900 |
Source: Public Records
Map
Nearby Homes
- 12880 Oxbridge Place
- 13935 Canonbury Way
- 12878 Ari Ln
- 13896 Willesden Cir
- 13008 Overview Dr
- 12748 Tamworth Dr
- 12706 Hannah Hill Rd
- 12985 Saxony Blvd
- 12680 Tamworth Dr
- 13616 Whitten Dr N
- 13172 Saxony Blvd
- 14156 Avalon Dr E
- 13484 Molique Blvd
- 13330 Saxony Blvd W
- 14237 Bay Willow Dr
- 12964 Walbeck Dr
- 13311 Susser Way
- 14110 Bay Willow Dr
- 13301 Minden Dr
- 13276 E Lieder Way
- 13873 Marble Arch Way
- 13853 Marble Arch Way
- 13883 Marble Arch Way
- 13854 Marble Arch Way
- 13893 Marble Arch Way
- 13874 Marble Arch Way
- 13884 Marble Arch Way
- 12924 Chorleywood Cir
- 13052 Ratliff Run
- 12964 Ratliff Run
- 12914 Chorleywood Cir
- 12895 Chorleywood Cir
- 12976 Ratliff Run
- 13062 Ratliff Run
- 13913 Marble Arch Way
- 13042 Ratliff Run
- 12996 Ratliff Run
- 13032 Ratliff Run
- 12885 Chorleywood Cir
- 12894 Chorleywood Cir