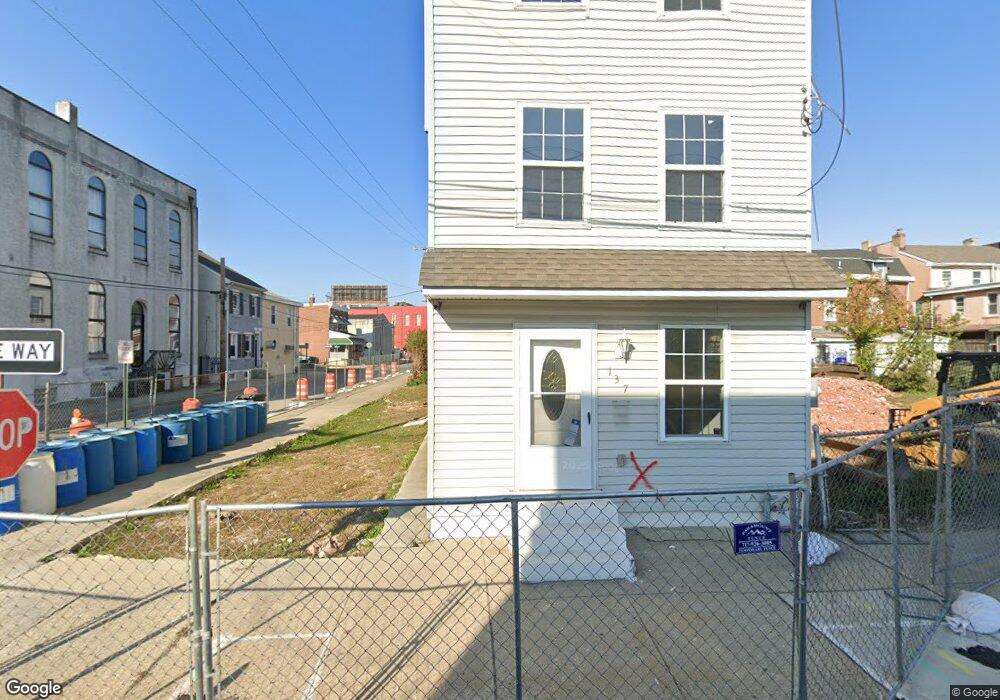
139 3rd St Bridgeport, PA 19405
Estimated Value: $429,500
4
Beds
1
Bath
1,294
Sq Ft
$332/Sq Ft
Est. Value
About This Home
This home is located at 139 3rd St, Bridgeport, PA 19405 and is currently priced at $429,500, approximately $331 per square foot. 139 3rd St is a home located in Montgomery County with nearby schools including Bridgeport Elementary School, Upper Merion Middle School, and Upper Merion High School.
Ownership History
Date
Name
Owned For
Owner Type
Purchase Details
Closed on
Jul 18, 2024
Sold by
Cooper Edward H and Cooper Maureen L
Bought by
Borough Of Bridgeport
Current Estimated Value
Purchase Details
Closed on
Nov 9, 2020
Sold by
Zzx Holdings Llc
Bought by
Cooper Edward H and Cooper Maureen L
Purchase Details
Closed on
Mar 26, 2014
Sold by
Schildt Justin and Schildt Jennifer
Bought by
Zzx Holdings Llc
Purchase Details
Closed on
Jun 28, 1996
Sold by
Meehan Robert B
Bought by
Meehan Robert B and Revocable Trust Agreement Robert B Meeha
Create a Home Valuation Report for This Property
The Home Valuation Report is an in-depth analysis detailing your home's value as well as a comparison with similar homes in the area
Home Values in the Area
Average Home Value in this Area
Purchase History
| Date | Buyer | Sale Price | Title Company |
|---|---|---|---|
| Borough Of Bridgeport | $437,000 | Germantown Title | |
| Cooper Edward H | $7,000 | None Available | |
| Zzx Holdings Llc | $20,000 | None Available | |
| Meehan Robert B | -- | -- |
Source: Public Records
Tax History
| Year | Tax Paid | Tax Assessment Tax Assessment Total Assessment is a certain percentage of the fair market value that is determined by local assessors to be the total taxable value of land and additions on the property. | Land | Improvement |
|---|---|---|---|---|
| 2025 | $1,367 | $34,670 | -- | -- |
| 2024 | $1,367 | $34,670 | -- | -- |
| 2023 | $1,329 | $34,670 | $0 | $0 |
| 2022 | $1,293 | $34,670 | $0 | $0 |
| 2021 | $1,283 | $34,670 | $0 | $0 |
| 2020 | $1,263 | $34,670 | $0 | $0 |
| 2019 | $1,247 | $34,670 | $0 | $0 |
| 2018 | $1,248 | $34,670 | $0 | $0 |
| 2017 | $1,215 | $34,670 | $0 | $0 |
| 2016 | $1,201 | $54,490 | $34,670 | $19,820 |
| 2015 | $1,838 | $54,490 | $34,670 | $19,820 |
| 2014 | $1,838 | $54,490 | $34,670 | $19,820 |
Source: Public Records
Map
Nearby Homes
Your Personal Tour Guide
Ask me questions while you tour the home.