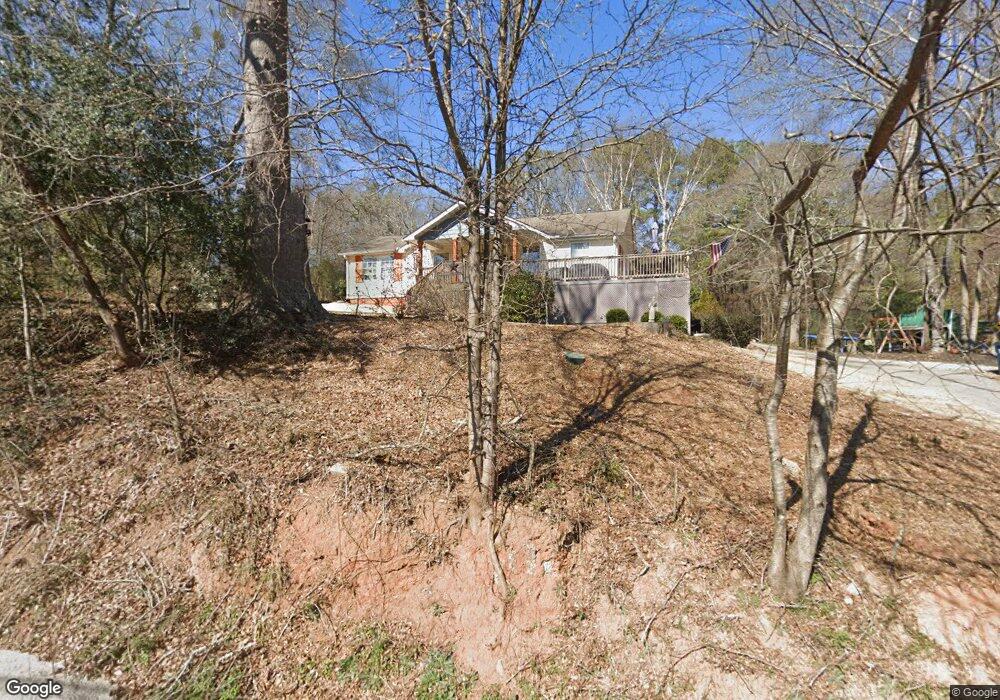
139 Belair Dr Stockbridge, GA 30281
Estimated Value: $225,127 - $254,000
3
Beds
2
Baths
1,521
Sq Ft
$159/Sq Ft
Est. Value
About This Home
This home is located at 139 Belair Dr, Stockbridge, GA 30281 and is currently estimated at $241,282, approximately $158 per square foot. 139 Belair Dr is a home located in Henry County with nearby schools including Cotton Indian Elementary School, Stockbridge Middle School, and Stockbridge High School.
Ownership History
Date
Name
Owned For
Owner Type
Purchase Details
Closed on
Nov 20, 2006
Sold by
Chamlee William M
Bought by
Gibby Chris R
Current Estimated Value
Create a Home Valuation Report for This Property
The Home Valuation Report is an in-depth analysis detailing your home's value as well as a comparison with similar homes in the area
Home Values in the Area
Average Home Value in this Area
Purchase History
| Date | Buyer | Sale Price | Title Company |
|---|---|---|---|
| Gibby Chris R | $115,000 | -- |
Source: Public Records
Tax History Compared to Growth
Tax History
| Year | Tax Paid | Tax Assessment Tax Assessment Total Assessment is a certain percentage of the fair market value that is determined by local assessors to be the total taxable value of land and additions on the property. | Land | Improvement |
|---|---|---|---|---|
| 2025 | $2,882 | $106,880 | $15,040 | $91,840 |
| 2024 | $2,882 | $98,600 | $13,880 | $84,720 |
| 2023 | $2,188 | $92,800 | $13,360 | $79,440 |
| 2022 | $2,222 | $73,080 | $12,320 | $60,760 |
| 2021 | $1,762 | $53,760 | $10,600 | $43,160 |
| 2020 | $1,685 | $50,520 | $9,960 | $40,560 |
| 2019 | $1,434 | $43,400 | $9,440 | $33,960 |
| 2018 | $1,397 | $42,440 | $8,720 | $33,720 |
| 2016 | $1,052 | $33,440 | $6,680 | $26,760 |
| 2015 | $897 | $28,960 | $6,720 | $22,240 |
| 2014 | $829 | $27,080 | $6,720 | $20,360 |
Source: Public Records
Map
Nearby Homes
- 0 E Atlanta Rd Unit @VALERIE CT 10464740
- 0 E Atlanta Rd Unit @KINSEY DR 10464743
- 20 Carriage Trace
- 20 King Place
- 128 Belair Ln Unit 1
- 0 Chimney Smoke Dr Unit 10640945
- 0 Chimney Smoke Dr Unit 182111
- 20 Lamp Post Ct
- 135 Springvalley Way
- 270 Mays Rd
- 393 Young James Cir
- 905 E Atlanta Rd
- 0 Oakview Dr Unit 10472931
- 0 Oakview Dr Unit 7533331
- 389 Young James Cir
- 230 Carriage Cir
- 453 Azalea Dr
- 277 Edison Dr
- 418 Honeysuckle Ln
- 90 Chimney Rise Ct
- 105 Evans Dr
- 163 Belair Dr
- 170 Belair Dr
- 176 Belair Dr
- 103 Evans Dr
- 101 Cottonbelle Dr
- 110 Evans Dr
- 179 Belair Dr
- 105 Cottonbelle Dr Unit 27
- 105 Cottonbelle Dr
- 184 Belair Dr
- 73 Evans Dr
- 93 Belair Dr
- 109 Cottonbelle Dr
- 80 Evans Dr
- 190 Belair Dr
- 192 Belair Dr
- 90 Belair Dr
- 100 Cottonbelle Dr
- 0 Evans Dr Unit 3244383