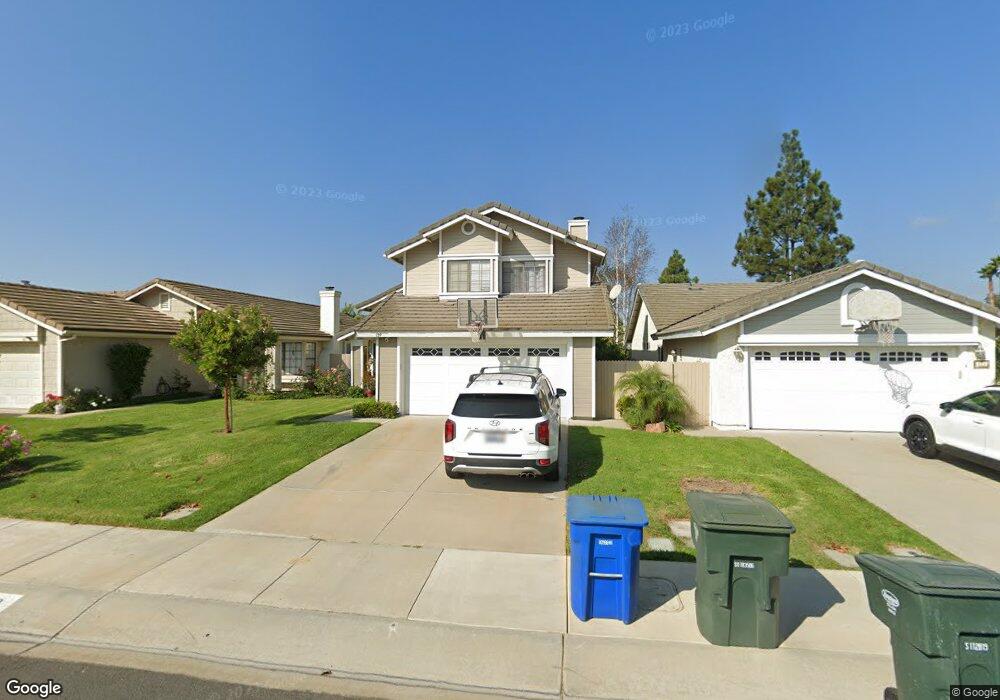
139 Camino el Rincon Camarillo, CA 93012
Estimated Value: $777,000 - $890,000
3
Beds
3
Baths
1,493
Sq Ft
$550/Sq Ft
Est. Value
About This Home
This home is located at 139 Camino el Rincon, Camarillo, CA 93012 and is currently estimated at $820,523, approximately $549 per square foot. 139 Camino el Rincon is a home located in Ventura County with nearby schools including Tierra Linda Elementary School, Las Colinas Middle School, and Adolfo Camarillo High School.
Create a Home Valuation Report for This Property
The Home Valuation Report is an in-depth analysis detailing your home's value as well as a comparison with similar homes in the area
Home Values in the Area
Average Home Value in this Area
Tax History Compared to Growth
Tax History
| Year | Tax Paid | Tax Assessment Tax Assessment Total Assessment is a certain percentage of the fair market value that is determined by local assessors to be the total taxable value of land and additions on the property. | Land | Improvement |
|---|---|---|---|---|
| 2025 | $3,718 | $342,227 | $119,775 | $222,452 |
| 2024 | $3,718 | $335,517 | $117,426 | $218,091 |
| 2023 | $3,584 | $328,939 | $115,124 | $213,815 |
| 2022 | $3,572 | $322,490 | $112,867 | $209,623 |
| 2021 | $3,442 | $316,167 | $110,654 | $205,513 |
| 2020 | $3,429 | $312,926 | $109,520 | $203,406 |
| 2019 | $3,412 | $306,791 | $107,373 | $199,418 |
| 2018 | $3,348 | $300,776 | $105,268 | $195,508 |
| 2017 | $3,150 | $294,879 | $103,204 | $191,675 |
| 2016 | $3,074 | $289,098 | $101,181 | $187,917 |
| 2015 | $3,040 | $284,758 | $99,662 | $185,096 |
| 2014 | $2,969 | $279,181 | $97,710 | $181,471 |
Source: Public Records
Map
Nearby Homes
- 113 Camino el Rincon
- 18206 Village 18 Unit 18
- 17101 Village 17
- 16302 Village 16
- 22106 Village 22
- 4112 Village 4
- 17223 Village 17
- 17306 Village 17 Unit 17
- 6118 Village 6
- 7202 Village 7 Unit 7
- 196 Mariposa Dr
- 5118 Village 5
- 23132 Village 23
- 25126 Village 25
- 11225 Village 11
- 5004 Ladera Vista Dr
- 369 Estancia Place
- 15122 Village 15 Unit 15
- 5662 Willow View Dr
- 676 Buenos Tiempos Dr
- 161 Camino el Rincon
- 187 Camino el Rincon
- 130 Camino Leon
- 108 Camino Leon
- 152 Camino Leon
- 209 Camino el Rincon
- 168 Camino Leon
- 160 Camino el Rincon
- 186 Camino el Rincon
- 225 Camino el Rincon
- 206 Camino el Rincon
- 190 Camino Leon
- 138 Camino el Rincon
- 5455 Camino Compadre
- 5443 Camino Compadre
- 220 Camino el Rincon
- 5467 Camino Compadre
- 112 Camino el Rincon
- 243 Camino el Rincon
- 5431 Camino Compadre